


Question:
Is a universal state retirement age fair?
Answer:
This really depends on what we mean by “fair”. On the surface, a benefit available at the same age for everybody sounds like a fair provision. However, turning this around and thinking about for how long people are expected to receive payments, the issue of fairness becomes more complicated. Is it fair that certain sections of society will expect to receive fewer payments than others?1
The recent debate about increases in state retirement ages around the world (e.g. in Canada, the UK, the US and France) has focused on the increases in life expectancy (LE) since the introduction of state retirement provisions2. However, life expectancy is not the same for everyone in society. The data show that lower income groups have shorter life expectancies. Therefore, on average, they will draw this benefit for less time. In addition, lower income groups have lower Health Adjusted Life Expectancies (HALE), so the amount of time spent enjoying this benefit in good health is also expected to be lower. What’s more these differences are increasing over time.
The chart below compares LE and HALE (both with no allowance for future improvements) at age 65 for both sexes in low and high income groups in Canada. The green wedges in each bar identify the differences between high and low income groups.

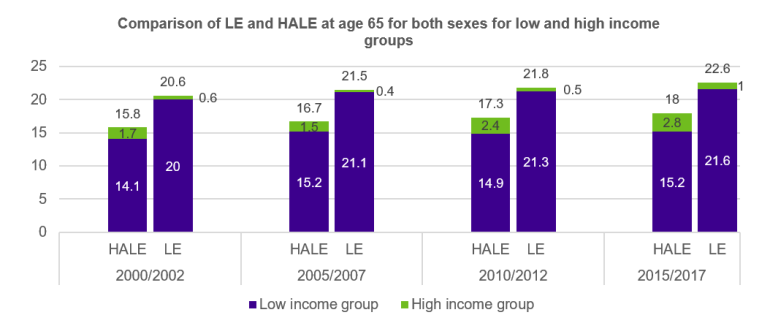
Source: Statistics Canada (Table 13-10-0370-01)
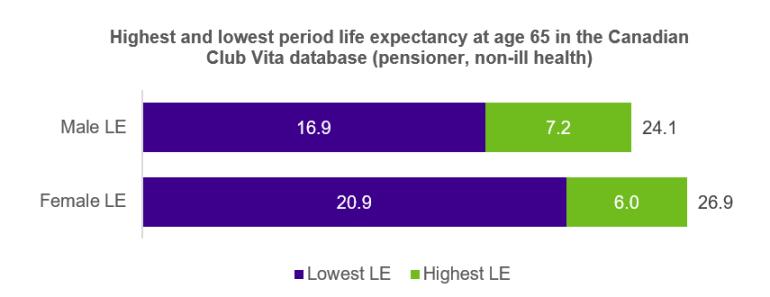
According to the Club Vita Canadian database, when taking into account various factors such as affluence, lifestyle, marital status and occupation, the gap in life expectancy between two individuals is much wider than shown above. The chart below illustrates the possible range in life expectancy at age 65 for a Canadian pensioner in the Club Vita database. The green wedges in each bar identify the differences between the highest and lowest life expectancy.
Key takeaways
- Life Expectancy varies considerably across different groups in society
- Health Adjusted Life Expectancy also varies considerably across different groups in society
- Both these differences have increased over time
- On average, people from higher socioeconomic groups enjoy both longer and healthier retirements than those from lower socio-economic groups and therefore draw a higher overall benefit from their state pension (from both an enjoyment and financial perspective)
- Increasing retirement age would have a greater effect on individuals from lower socio-economic groups
The key questions are:
- What is the main goal of a state pension? Is it even aimed at providing equity in value?
- If we are aiming at equity in value, how could that be implemented?
- Could different tranches of state benefits typically drawn by individuals with different income levels be available at different ages? For example, in Canada, could there be different retirement ages for Guaranteed Income Support (GIS), Old Age Security (OAS) and the Canada Pension Plan (CPP) / Quebec Pension Plan (QPP)?
- Is the real question not how to change state benefit provisions, but how to reduce inequality in life expectancy and health adjusted life expectancy across society?
What do you think?
1 Note we are not talking about the issue of a person outliving or underliving their life expectancy as a result of chance. This is part of the risk pooling effect needed to provide an insurance-type benefit like a pension. We are instead talking about the differences in life expectancy itself between different sections of society.
2According to the United Nations (World Population Prospects data), when the CPP was established (in 1965), LE at age 65 for both sexes was 15.1 and increased to 21.1 in 2019.