


Frequently asked questions
Our team of experts has answered a series of questions commonly asked by pension plans about Club Vita’s unusual service. The questions are grouped into five categories:
1. Introducing Club Vita
1.1 What is Club Vita?
Club Vita is a center of excellence for improving understanding of human longevity, originally set up in the UK in 2009 and subsequently expanded into Canada and the USA.
Our core members are defined benefit pension plans with a desire to pool data to better understand longevity risk. Our club has also attracted a growing following of insurers, academics and advisors. All parties share a common interest in longevity and believe that the bigger the data, the lower the statistical noise.
Club Vita has developed a suite of longevity risk informatics to support pension plans’ risk management strategies and enable innovative and efficient risk transfer mechanisms. Our informatics help pension plans take control of longevity, so that it becomes an actively managed risk rather than just an actuarial assumption.
1.2 How do you define longevity risk and how does it differ from mortality risk?
Mortality risk is the financial exposure to people dying sooner than assumed. It affects life insurance policies because there are fewer premium payments and less opportunity for investment growth when people die earlier than expected.
Conversely, longevity risk is the risk of people living longer than assumed. It is found in pension products like annuities and in equity release mortgages. Governments are particularly exposed to longevity risk because of unfunded pension promises and healthcare service expectations.
Combining mortality and longevity risks reduces the overall riskiness: the sum is less risky than the two parts in isolation due to inverse correlation.
1.3 Why is longevity risk often described as an “unrewarded” risk?
A pension plan’s exposure to longevity risk is sometimes described as unrewarded because, unlike taking investment positions which are taken in the pursuit of reward, it receives no gain from taking the risk of pensions being in payment for longer than assumed. Equally, the plan benefits if pensions are in payment for a shorter period than assumed. “Unmanaged risk” is perhaps a more accurate description of the pay-off profile than “unrewarded”.
Life insurers are in a stronger position to take longevity risk than pension funds because they can offset it against their mortality risk. Life insurers are seeking reward for taking longevity risk and have more strategies available to them than pension plans to actively manage the risk.
The key difference between investment risk and longevity risk, is that investment risk is rewarded: the plan, on average and over the long-term, can earn a higher return from putting money at risk. Pension plans get no upside from their exposure to longevity risk.
2. Solid data foundations
2.1 What makes your approach to data collection different to the way that actuarial tables have been traditionally produced?
- We collect data on postal codes and affluence indicators such as salaries or pension amounts, providing powerful explanations of differences.
- We don’t just look back for three years, but as far as the data is reliable, collecting more data points.
- We seek the same data items from everybody in the Club – including postal code, gender and affluence, creating a consistent data structure that can be sliced and diced in different ways.
- We apply deep cleansing techniques to get the most insight out of reliable and accurate data.
By investing in data collection, we are able to recommend individual survival assumptions for each participant of your pension plan, rather than crudely adjusting an off-the-peg table.
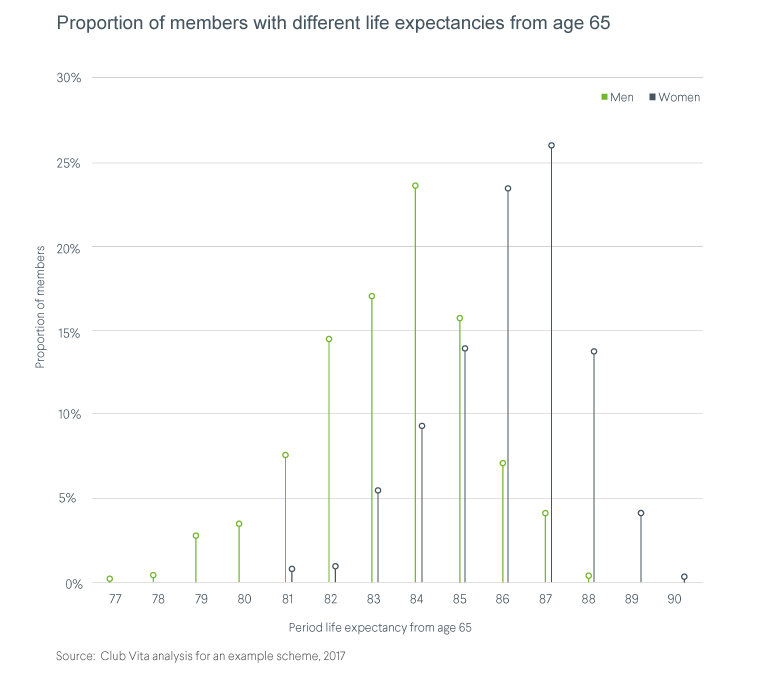
2.2 Why do you collect so many data fields?
We only collect data fields that have been shown to have statistically significant effects on life expectancy. This richness of data allows us to distinguish large differences in life expectancies within a single plan’s pensioner population. Below is a chart showing how these life expectancies typically differ within a plan:
2.3 Do you collect or link to any health data on the individual?
No. A pensioner’s administration records typically show whether someone retired early on grounds of ill-health, but we seek no information on the cause of any ill-health retirement, nor seek any data on current health of pensioners. That’s because we see insufficient benefit to the management of longevity risk in most group pension plans.
Different people are ageing at different rates - our biological clocks are ticking at different rates. This is very relevant information when an individual person is buying a life insurance or annuity contract.
But our focus is on groups rather than individuals. Differences between people are diluted in group plans, particularly when information on postal codes and affluence is collected. The marginal benefit of having health information on the individual person, over and above socio-economic data, quickly reduces as the population size increases. For defined benefit plans with, say, 200 or more pensioners, there will be little or no benefit from collecting health data.
That is not to say that there are not material differences between the portfolio averages for plans – in the UK, we observe differences of up to six years in the portfolio averages, depending on the socio-economic mix of the plan.
3. Increasing confidence in your baseline
3.1 Isn’t life expectancy linked to region?
Yes and no.
Whilst it is generally true that life expectancy is higher in certain areas, if you zoom in closer, you find that people with high and low life expectancy are dotted around the country often in neighboring areas, for example.
If you explore Club Vita’s longevity map, you’ll see it resembles a patchwork quilt, with variations associated with both affluence and lifestyle.
4. Understanding longevity trends
4.1 How will Club Vita members get insights into emerging trends?
In the UK, we track changes in survival rates in three broad socio-economic groups, which we call Comfortable, Making Do and Hard Pressed. Collectively, we call these groups VitaSegments. We will soon complete similar analysis in Canada to gain an understanding of socio-economic trends.
We believe socio-economic groups are the best way of segmenting the population because:
- differences in longevity follow lifestyle and environmental factors;
- there are material differences in the socio-economic profiles of individual plans, so one size does not fit all;
- the liabilities in the Comfortable group have disproportionate weight given the size of the pensions.
Our approach means that you can tailor your assumptions to the characteristics of your plan, and you can monitor the emerging experience and take earlier action.
5. Adopting Club Vita’s insights in your plan governance cycle
5.1 Will our consultants be able to use your VitaCurves model?
Yes, base table results can be provided to your actuarial advisor in a variety of different formats. Depending on your preference we can provide any of the following:
- VitaCurves mappings for each individual participant to enable full flexible “bottom-up” valuations
- Bespoke mortality tables to use for the main sections of your plan (usually male and female tables for pensioners, deferreds and actives)
- Weightings to apply to standard actuarial tables
Additional analysis provided by Club Vita is included in your annual suite of reporting and we work with you and your advisors to ensure our analytics inform and support the wider advice that you receive.
Meet the team
Club Vita could not deliver the vast array of statistical insights without our gifted team.