Question:
How does alcohol consumption differ between the UK, US and Canada?
Answer:
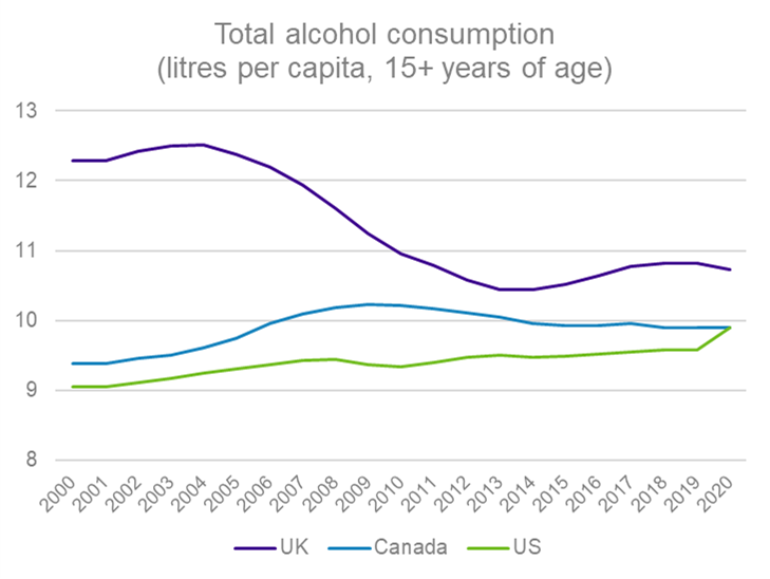
Attitudes towards drinking alcohol differ across the UK, US and Canada. According to World Bank data up to 2020, the UK had the highest per capita alcohol consumption (in litres), followed by Canada and then the US. However, between 2000 and 2020, alcohol consumption declined in the UK, while it rose in both the US and Canada. This trend is illustrated in the chart below.

Source: World Bank Group, World Development Indicators. Downloaded 19 August 2025.
A recent survey from the US polling organization Gallup has reported a significant reduction in the number of adults in the US who drink alcohol. In 2025, Gallup found that only 54% of US adults were drinking alcohol, down approximately 11% from their 2019 results. For comparison, the World Health Organization (WHO) reported in 2019 that 71% of US adults consumed alcohol, compared to 78% in the UK and 69% in Canada. This suggests that more people, especially Americans, are rethinking their relationship with alcohol.
Key takeaways
- According to the Mayo Clinic, drinking alcohol at any level is detrimental to health. So, trends in alcohol consumption could affect future mortality and morbidity rates.
- Out of the three Club Vita geographies, historically alcohol consumption has been highest in the UK, followed by Canada, followed by the US.
- However, over the first 20 years of the century, we’ve seen alcohol consumption decrease in the UK but increase in the US and Canada.
- Recent data has indicated that the number of people in the US abstaining from alcohol has increased in recent years.
The key questions are:
- How has alcohol consumption in the US, UK and Canada changed since 2020? (Is the reduction captured in the Gallup survey in the US accurate?)
- Are different subsections of society experiencing differing trends in alcohol consumption?
- How will these trends affect future mortality rates?


