


The recently published Canadian Pensioner Mortality 2024 (CPM2024) tables are calibrated to pensioner mortality data covering 2011 to 2021, and so include data from the COVID-19 pandemic, during which mortality rates in Canda were particularly high.
In this article, we examine the different approaches actuaries may take in allowing for pandemic experience when calibrating baseline mortality. We will compare the study’s approach to that taken in Club Vita’s latest VitaCurves, as well as some important considerations when using mortality tables which cover the pandemic period.

Impact of COVID-19 in Canada (general population)
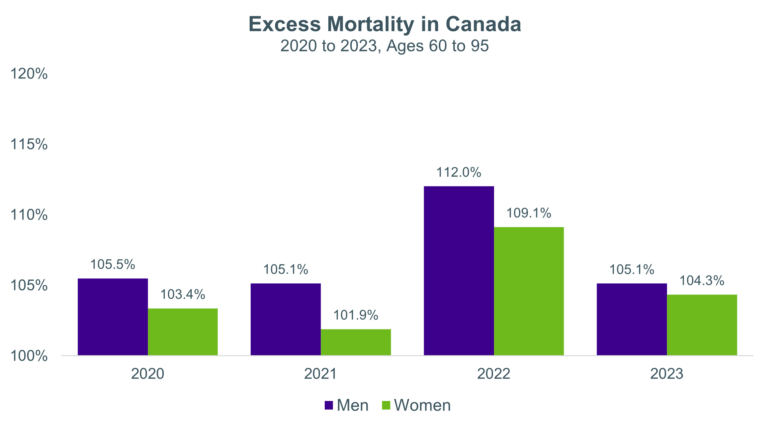
In our previous Top Chart, we discussed how Canada saw elevated mortality at the population level over 2020-2023. Excess mortality peaked in 2022, but 2023 still saw more deaths than expected, for both men and women. Provisional data suggests 2024 also saw excess mortality, albeit at lower levels than 2023.
Defining excess mortality
Any calculation of "excess" deaths requires a number of subjective decisions to define expected deaths, which can then be compared with actual experience over a given period.
For example, the population excess mortality figures shown above are based on expected deaths in each year estimated using age-specific mortality rates from Statistics Canada's 2017/2019 life tables1. The mortality rates were projected forward using the MI-2017 improvement scale, and then applied to annual population exposures2 to calculate expected deaths. We then compared age-standardized expected mortality with age-standardized3 observed mortality for each year. This approach accounts for changes in population size and age structure in each year, ensuring that excess mortality estimates reflect true shifts in mortality patterns.
Different methodologies can yield different estimates of excess mortality, depending on assumptions about mortality trends, as well as the reference period and data used. For example, had we instead used the MI-2024 improvement scale in the calculations above, we would have obtained higher excess mortality values.
Allowing for excess mortality in calibrating mortality tables
When calibrating baseline mortality tables over time periods which include the pandemic years, with the associated excess mortality, there are two potential approaches we could take:
- Make no adjustments, so embed the observed higher mortality rates in the resultant base tables; or
- Remove the "excess" mortality, producing base tables with lower mortality rates that do not fully reflect pandemic experience.
The first approach, with no adjustment, is the most objective. All else being equal, this approach will produce "heavier" mortality base tables, which will lead to lower life expectancy and lower plan liabilities. If we believe the elevated mortality during the pandemic was temporary, such an approach is unlikely to produce mortality rates that are representative of future experience.
The second approach is inherently more subjective, as it requires decisions around both how to measure excess mortality (as discussed above), and how best to adjust mortality rates to remove the defined excess.
Both approaches have merits in different circumstances. The most appropriate approach will therefore depend on the purpose to which the mortality tables are being applied, as discussed below. The new CPM2024 tables and the latest version of Club Vita’s multi-factor baseline mortality model, VitaCurves, have both been calibrated to data that cover some of the COVID-19 pandemic period, and both include versions where COVID-19 excess mortality has been stripped out of the published mortality rates. We discuss these approaches in more detail below.
Approach taken in CV24 VitaCurves
The latest version of Club Vita’s Canadian VitaCurves (CV24) was calibrated over 2020 to 2022, so included the initial COVID-19 period. We made available two distinct versions of the CV24 Canadian VitaCurves:
- "Business As Usual" (BAU) VitaCurves constructed using the usual calibration process, with no adjustments for COVID-19 excess;
- Adjusted VitaCurves, where adjustments have been applied to "strip out" excess mortality.
We defined the level of "excess" mortality seen in the Club Vita data during each year (2020 to 2022) as the ratio of the actual to expected age-standardized mortality rates, based on experience in the Club Vita data in each year (where the "expected" value is based on rolling forward fitted 2017-2019 mortality rates, in line with the MI-2017 improvement rates)
Our calculated excess mortality levels in the Vita data in each of the three years in the calibration period are shown below.
Excess mortality (ages 60-95) | 2020 | 2021 | 2022 |
Men | 2.6% | 3.4% | 8.3% |
Women | 6.3% | 4.2% | 8.4% |
While excess levels are generally lower than seen in the general Canadian population, we see a similar pattern with higher excess in 2022.
We converted these excess mortality levels to adjustment factors, which we then applied to remove our estimate of the excess mortality due to COVID-19 from the BAU VitaCurves, giving us our Adjusted VitaCurves.
By publishing both versions, we allow users the option to alternatively apply their own adjustments to the BAU VitaCurves, depending on their views on the appropriate level of adjustment to make to baseline mortality in light of the pandemic.
Approach taken in CPM2024
In the 2024 Canadian Pensioner Mortality Research Project they adopted a thoughtful approach to pandemic experience, by capturing the first COVID-19 peak in the model, and fitting to ensure the excess mortality is excluded from the graduated baseline rates.
This was done by first identifying seasonal variations in death rates (with deaths typically higher in winter months and lower in summer months). In doing so, the modellers were then able to classify residual “excess” mortality, when compared to the modelled seasonal variation. This process identified a “spike” in mortality in April/May 2020 linked to the initial impact of COVID-19 (an additional spike in December 2020 into January 2021 was considered, but ultimately not treated as being COVID-19 related4).
While the CPM2024 tables were calibrated over 2011 to 2021 (and so excluded 2022, the heaviest year of pandemic experience in Canada), they were projected forward to an effective date of January 2024, after first isolating the pandemic impact, in the form of the spike seen in Spring 2020.
The final CPM2024 tables are therefore similar conceptually to Club Vita’s adjusted VitaCurves, as the “excess” mortality has been removed from the graduated rates.
Considering the use case
When determining whether to use a base table which includes COVID-19 mortality, or one that has stripped out the excess mortality, it is important to consider the purpose of the analysis.
For example, if considering a plan’s liabilities, a base table with no excess mortality may be viewed as more appropriate, particularly when combined with an improvement scale that calibrated to pre-pandemic data (as is the case for CPM-B, MI-2017 and MI-2024).
Alternatively, when carrying out an experience analysis which includes pandemic years:
Using a base table with excess mortality removed (e.g., CPM2024 or Adjusted VitaCurves)
The use of a base table with the excess mortality removed may give misleading results over the pandemic years, unless adjustments are made to the expected or deaths over pandemic years to reflect the higher levels of mortality observed.
This is the case for conducting an experience analysis with CPM2024 tables. Recent guidance from the CIA emphasizes the importance of evaluating pandemic years separately and avoiding mechanical adjustments without considering plan specific experience.
Using a base table with embedded excess mortality (e.g., BAU VitaCurves)
The use of a base table with embedded excess mortality may give misleading results in pre- and post-pandemic years. In addition, any embedded excess mortality may not fully reflect a given plan’s underlying profile, especially for plans with a strong geographical concentration, so further adjustments may be required.
Interaction with improvement scales
As well as base table considerations, we also need to consider how the base table will interact with the chosen improvement scales to project mortality rates into the future (and into the past, for example in an experience analysis). Again, it is important to consider the use case here.
Our next deep-dive article on CPM2024 will discuss the considerations for using the CPM2024 base tables with different approaches to constructing improvement scales.
1Statistics Canada. Table 13-10-0114-01 Life expectancy and other elements of the complete life table, three-year estimates, Canada, all provinces except Prince Edward Island
2Human Mortality Database (HMD). Max Planck Institute for Demographic Research (Germany), University of California, Berkeley (USA), and French Institute for Demographic Studies (France). Available at mortality.org (data downloaded on September 10, 2025)
3Age standardization completed using the 2021 Canadian census population structure.
4 Its magnitude was deemed comparable to prior influenza-related winter peaks (e.g., 2013, 2015, and 2018) and it was followed by an unusually low mortality month in February 2021. As such, it was determined to not warrant a distinct COVID-19-related adjustment.