


As new cases of COVID-19 continue to climb across much of Canada, we wanted to share an update regarding the latest picture of the pandemic’s impact on Canadian mortality during 2020.

Chart 1 below illustrates how the average daily number of new cases (per million people in each province) during the second wave compares to the levels during the first wave for provinces outside of the “Atlantic bubble.” The chart shows how the current relative level of cases is significantly higher than during the first wave for all the provinces included other than Quebec, which is only modestly higher. Further, adjusting for population size highlights just how dramatic and concerning the levels of cases are for Alberta, Manitoba and Saskatchewan.
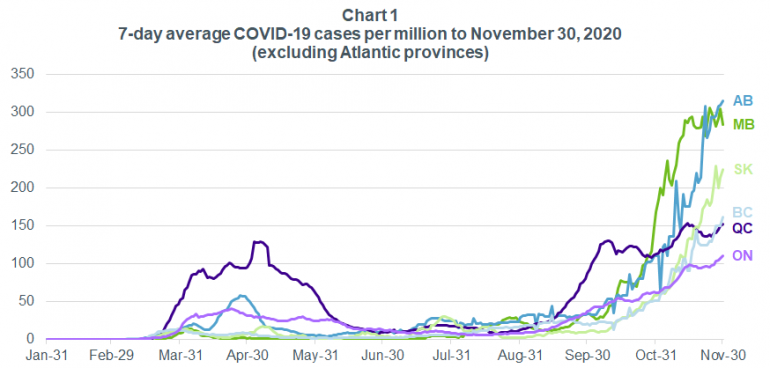
Data source: COVID-19 Canada Open Data Working Group. Statistics Canada, Table 17-10-0005-01 Population estimates on July 1st (2020).
The average daily new cases for all of Canada have now tripled the highs reached during the first wave, as highlighted by Chart 2 below. However, the relative levels of COVID-19 deaths (measured by the right-hand axis) during the second wave so far have been much lower than that experienced during the first wave, although the number of deaths are approaching that experienced during the first wave. Some key contributors to the lower relative levels of deaths during the second wave are:
- Second wave new cases have seen much lower proportions of those aged 70 and older (~10%) compared to the proportions during April and May (~30%), however the proportion of new cases aged 70 and older have been slowly increasing.
- Additional safeguards have been in place for some time to better protect long-term care residents, and society has an even greater awareness of the significant risk COVID-19 poses to seniors than during the early stages of the first wave.
- Physicians have made considerable advances regarding the best ways to treat serious cases of COVID-19 through their experiences to date.
- Testing levels during the second wave have been much higher than during the first wave, which has likely led to the identification of a higher number of mild cases of COVID-19.
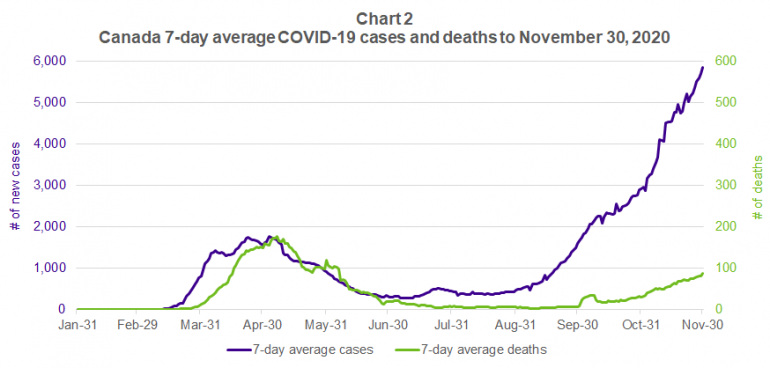
Data source: COVID-19 Canada Open Data Working Group.
Notes: The bump in deaths in early October was a result of late reported deaths from earlier in the year by Toronto Public Health.
In order to really understand the impact of COVID-19 on Canadian mortality, we need to look at all deaths, not just those due to COVID-19. Chart 3 shows the latest estimates from Statistics Canada regarding 2020 total weekly deaths for all of Canada. The bars represent the number of total deaths in Canada by week, with the dashed line being the average experienced from 2015 to 2019. The dark blue portion of the bars represent the number of reported COVID-19 deaths.
If COVID-19 deaths were the only driver of the excess deaths experienced in 2020, we’d expect the portion of the bars above the dashed line to all be dark blue. However, we do have a portion of light blue above the dashed line, particularly in late March and April, but also over the summer months. We suspect there are a few factors causing this result, with one being that there are likely unreported COVID-19 deaths, particularly in the early weeks of the pandemic. Based on the period shown, COVID-19 deaths only account for about 60% of the excess deaths experienced to September 26th, 2020.
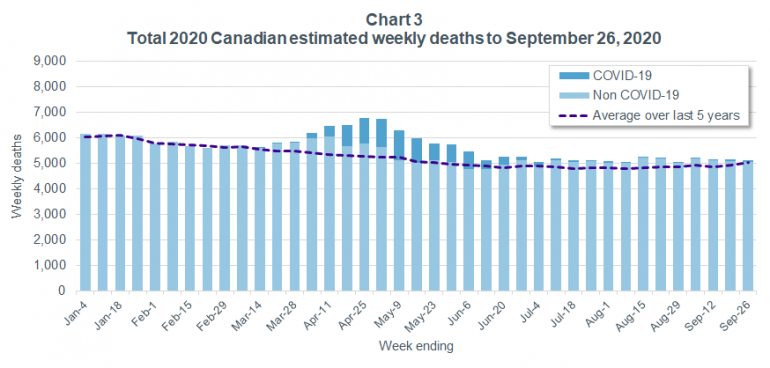
Data source: COVID-19 Canada Open Data Working Group Statistics Canada, Table 13-10-0768-01 Weekly death counts, by age group and sex (2015 to 2019) and Table 13-10-0784-01 Adjusted number of deaths, expected number of deaths and estimates of excess mortality, by week (2020).
While Chart 3 only shows data up to September 26th for Canada as a whole, the most recent total weekly death data for Quebec available through the Institut de la statistique du Quebec covers until November 4th. Chart 4 below illustrates how the increase in deaths experienced in Quebec during the first wave was much larger than that for all of Canada, but also highlights that COVID-19 deaths explain a greater proportion of the excess deaths in Quebec over 2020. In Quebec, COVID-19 deaths account for about 90% of the total excess deaths so far during 2020. When looking at the weeks shown in Chart 4 for the second wave, we see that weekly deaths started to increase somewhat starting in late September, with larger increases in the last two weeks shown.
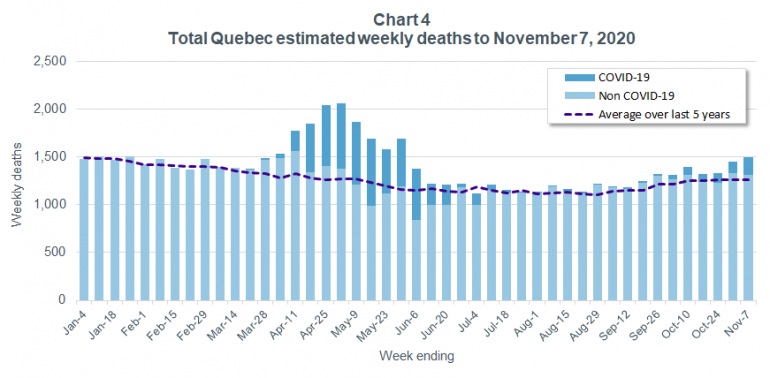
Data sources: Statistics Canada, COVID-19 Canada Open Data Working Group. Institut de la statistique du Québec, Weekly number of deaths in Québec, 2010-2020.
While Quebec has the most up-to-date data available of all provinces regarding 2020 deaths, our largest province only has data available to September 5th and that includes some meaningful adjustments by Statistics Canada to try to account for lags in Ontario’s reporting of deaths.
When comparing 2020 estimated deaths (up to September 5th) across all of Canada to that over the same period of weeks over 2015 to 2019, we find that 2020 deaths are 8% higher than the average over the preceding five years. Chart 5 shows how the increase in 2020 deaths compares by province over the same period. Surprisingly, Alberta has the second highest percentage increase in total deaths in 2020, despite having relatively low numbers of reported COVID-19 deaths compared to other provinces over the period shown. It is also surprising that British Columbia’s increase in deaths is slightly higher than that for Ontario, despite having just over 200 reported COVID-19 deaths as of September 5th.
One of the contributing factors to the increase in Alberta and British Columbia deaths during 2020 has been an increase in overdose deaths, which tragically appear to be an indirect effect of the pandemic (e.g., lack of normal social support leading to increased drug use and greater drug use while alone). Another very concerning indirect effect of the pandemic has been that many Canadians have put off seeking medical treatment or seen medical procedures deferred. We don’t yet know what impact the delay of medical treatment has had on deaths across Canada during 2020, but this has most likely contributed to the increase and could also have a negative impact over the coming years.
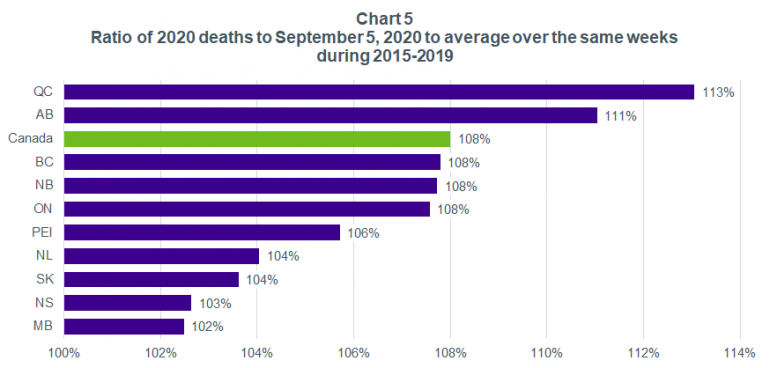
Data sources: Institut de la statistique du Québec, Weekly number of deaths in Québec, 2010-2020 (Quebec). Statistics Canada, Table 13-10-0768-01 Weekly death counts, by age group and sex (2015 to 2019 deaths, other than Quebec), Table 13-10-0784-01 Adjusted number of deaths, expected number of deaths and estimates of excess mortality, by week (2020 deaths, other than Quebec) and Table 17-10-0005-01 Population estimates on July 1st (2020).
Notes: We expect to see larger year-to-year fluctuations in the level of deaths for smaller provinces, which makes it difficult to assess if the increases observed for New Brunswick (which only includes data to August 8, 2020) and PEI are anything more than normal volatility.
While the percentage increases shown above in Chart 5 don’t translate to the actual average increases in mortality rates, they do provide a good indication of the magnitude of the increase at a provincial level. It is important to keep in mind that province-level statistics cover very large and diverse populations, and there will be subsets that have had much different experiences. For example, the corresponding statistic to those shown in the chart above for the Montreal and Laval health regions combined is 128% (these two health regions were the hardest hit in Quebec during the first wave). Unfortunately, data regarding total deaths in 2020 is largely only available at a provincial level, so it is difficult to fully assess the impact of the pandemic at smaller regional levels at this time.
As Club Vita Canada collects 2020 longevity data from our club members, we will be investigating how mortality has varied for different sub-populations. We plan to particularly focus on socio-economic status given growing evidence that lower socio-economic groups have experienced disproportionately higher COVID-19 infection and mortality rates. We believe this is important for not only understanding the impact COVID-19 is having on current mortality, but also for understanding what the short and long-term implications may be for Canadian longevity.