


Key findings from Club Vita Canada's first annual study of defined benefits pensioner longevity
1 June 2017
Since the mid-2000s, pension and post-retirement benefit plan sponsors in Canada have become more aware of the risks inherent in their plans. Many plan sponsors have spent the last decade focusing on investment and interest rate risks. This isn’t surprising given their substantial volatility. Consequently, many Canadian plan sponsors have put in place carefully constructed risk management frameworks. However, they have just started to investigate what is often their plan’s next most important risk: longevity risk.
Unlike investment and interest rate risks, longevity risk is an unrewarded risk that comes with providing retirement benefits. The behaviour of longevity risk is also quite different than other risks. Longevity generally moves gradually, yet infrequent measurement has resulted in sizable liability increases when periodic studies are released. Longevity affects most decisions in retirement plans, including their funding and accounting. It is also an important underlying factor when determining a plan’s investment strategy and when considering plan design changes.
Club Vita Canada allows Canadian plans to access a new level of longevity measurement and research in line with global best practices.
Key Finding #1
It’s more accurate to measure longevity at an individual rather than a plan level
The approach to longevity measurement employed by most plans in Canada is to focus at a plan level. For example, the primary distinguishing factor for Canadian pensioner longevity assumptions (beyond age and gender) is whether a pensioner was part of a private – or public – sector plan. It’s also common to extend this plan-level focus to differences in longevity based on industry (e.g., financial services, manufacturing, etc.).
Unfortunately, the plan-level approach is inherently flawed, because it doesn’t account for the fact that plan populations are diverse – even within a particular industry. Focusing on individual member-level characteristics is much more effective. It provides plan sponsors the framework they need to understand the drivers behind how long their pensioners are living.
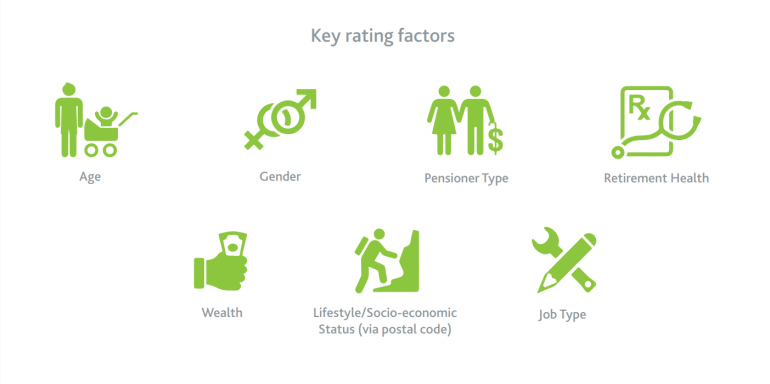
For instance, Club Vita Canada’s inaugural study found the following were the best factors (in addition to age) for differentiating how long Canadian retirees live:
• gender;
• if they were disabled when they retired;
• if they were the original plan member or a surviving spouse;
• their lifestyle/socio-economic status (determined by postal code);
• their level of affluence, measured by salary at retirement or, if not available, by pension amount; and
• if they worked in a blue-collar or white-collar job.
We also investigated many other factors, including whether the plan member worked in the public or private sector and industry. But we found that they were not statistically significant in the context of the above factors.
We’ve created our own baseline mortality assumptions, referred to as VitaCurves, which represent plan members with similar longevity characteristics based on the factors listed above.
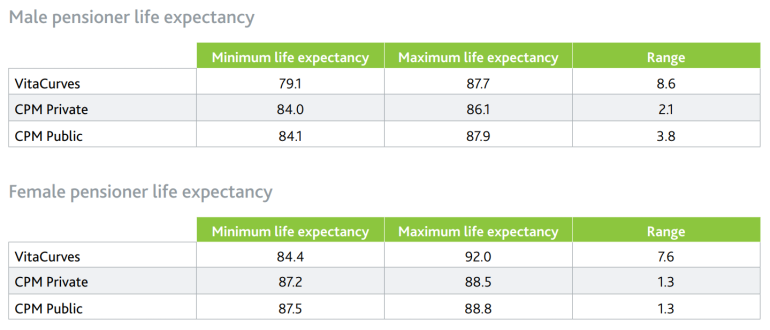
The tables below show the range of life expectancies1 for male and female pensioners aged 65 using our VitaCurves. They’re compared with the corresponding ranges for the most commonly used assumptions for private – and public – sector pension plans2 developed and reported in the Canadian Pensioners’ Mortality (CPM) study published by the Canadian Institute of Actuaries in February 2014. The minimum life expectancy represents members with the poorest longevity characteristics, whereas the maximum life expectancy represents those with the best longevity characteristics. VitaCurves gives plan sponsors the probabilities of survival at each age for each individual member. By investigating a larger range of individual longevity factors, we’ve captured a much wider range of life expectancies.
Key findings #2:
Public-sector pensioner mortality is very similar to private-sector pensioner mortality
To study whether the common pension industry mortality tables published in the CPM study are representative of the data Club Vita Canada collected, we compared the tables’ expectations to the number of deaths in VitaBank. What we found was that over the past decade, a greater proportion of pensioners died within VitaBank than that expected. Interestingly, the main driver of this result was due to public-sector pensioners within VitaBank exhibiting a consistently different level of mortality over time than what was found for public-sector pensioners in the CPM study.
The chart below compares the actual number of pensioner deaths in VitaBank (dark green bars) to the expected number of pensioner deaths based on the CPM Combined mortality table (light green bars), which combines both public-sector and private-sector data in the CPM study. As can be seen, VitaBank’s actual deaths are consistently higher than the expected deaths. And the actual-to-expected ratio (A/E ratio) – the orange line – is greater than 110% over the entire period.
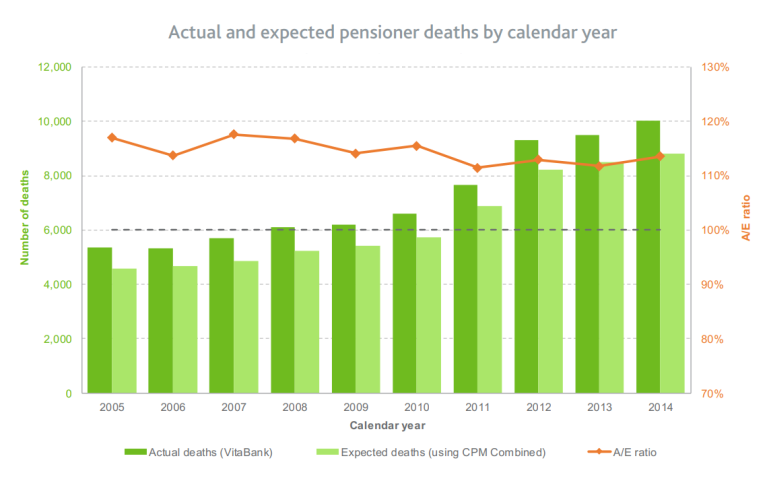
If we focus only on the most recent three years of experience (i.e., 2012 to 2014), VitaBank pensioner deaths were 13% higher than those based on the CPM Combined mortality table (i.e., an A/E ratio of 113%). The A/E ratio was somewhat higher for males (116%) and lower for females (108%).
While a comparison based on the number of pensioner deaths is helpful and easy to understand, a more robust analysis is possible by including survivors and accounting for the pension amounts of those that have died. The table below compares the A/E ratio for private – and public – sector plans within VitaBank to the CPM Combined, Private and Public assumptions after including survivors and accounting for pension amounts.
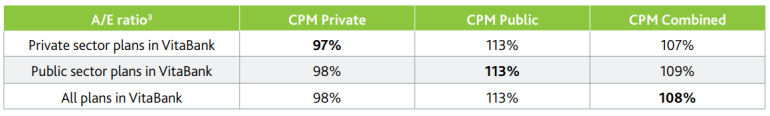
If we look at the ratios in bold in the table above, we see that the experience for private-sector pensioners across VitaBank is close to that expected under CPM Private, whereas the experience for VitaBank public-sector pensioners is materially higher than that expected under CPM Public (i.e., 113% versus 100%). So, the overall result of the higher number of deaths across VitaBank compared to that expected based on CPM assumptions is attributable to a difference in experience for public-sector pensioners. The reason for this difference in experience for public-sector pensioners is simple – it’s due to differences in the longevity profile of the underlying populations in Club Vita Canada’s study compared to the CPM study.
The table above also highlights that VitaBank’s experience has been quite similar for public – and private – sector pensioners (i.e., A/E ratios are quite similar within each column). Both the private – and public – sector plans within VitaBank cover a diverse range of member types, so it’s not an unreasonable result that, on average, the experience is similar. However, the differences in the results between our study and the CPM study highlight the pitfalls of using plan-level characteristics to set mortality assumptions. That is, plan-level results are sensitive to the longevity profile of the underlying populations. And unless this is controlled for, different studies can produce very different results.
The differences in the results between our study and the CPM study highlight the pitfalls of using plan-level characteristics to set mortality assumptions.
Key finding #3
Focusing on member-level factors allows mortality expectations to be tailored to individual plans
The challenges with a plan-level approach to mortality presented earlier are not new. In fact, many large plans have been taking steps to adjust the CPM mortality tables to align better with their plan’s experience. Unfortunately, applying adjustments to published tables is a blunt method and doesn’t improve the measurement of mortality for individual members. It also doesn’t provide insight into the drivers of longevity and how these may be changing. And small – and medium-size plans often don’t have enough credible data to even develop adjustments and may simply adopt the CPM Combined mortality table. If so, their longevity may be overstated in their valuation results, and may provide poor results when CPM mortality assumptions are used for other purposes, such as cash flow projections, and investment strategy analysis (e.g., asset/liability studies).
By instead focusing on member-level longevity factors, longevity expectations can be tailored to individual plans such that it much better aligns with experience without having to employ the blunt force adjustment approach discussed above. This is done by using the longevity characteristics of each plan member to identify the most appropriate mortality expectations for each and every member. An added benefit is that this approach accounts for any changes in the longevity profile of plan members over time. This is particularly helpful, as the longevity characteristics of those retiring today may be different than those who retired 20 years ago due to business and work environment changes.
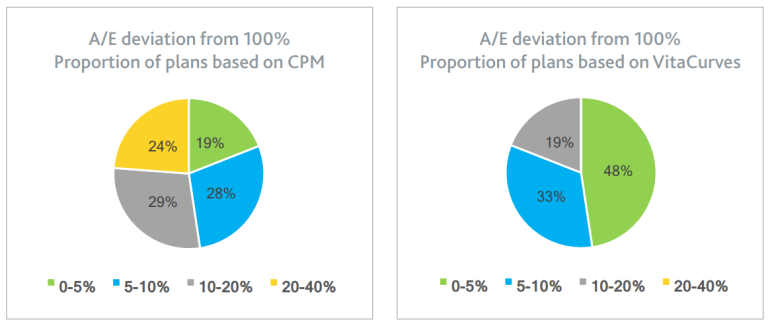
The chart below (left) shows how well the CPM mortality tables fit each plan that submitted data to Club Vita Canada4 . The optimal result is that the actual deaths equal that expected by the CPM mortality tables, for an A/E ratio of 100%. The poorer the fit, the more different the A/E ratio from 100%. This chart shows that the CPM mortality tables only fit well for a small proportion of plans (e.g., only 19% have an A/E ratio from 95% to 105%).
The next chart (right) shows the same result when using member-level longevity factors to create the mortality assumptions. This chart shows that almost 50% of plans now fall within the 95% to 105% range and no plan’s A/E ratio is more than 20% away from the optimal result of 100%. Some variation in A/E ratios is expected, with high potential variation for small plans and much less for larger plans.
A word about Club Vita’s Methodology
Club Vita Canada’s methodology investigates the longevity experience of groups of individual Canadian pensioners who exhibit similar characteristics (i.e., affluence, lifestyle, occupation, etc.), regardless of the plan to which they belong. We employ advanced statistical modelling techniques to make this investigation, all of which are consistent with those used by advanced markets (e.g., the UK and insurance companies). By doing this, we identify those factors that best explain differences in longevity.
The most appropriate longevity assumption is then determined for each individual member. These individual longevity expectations are then aggregated across the entire plan’s membership – that is, it’s a bottom-up approach. This contrasts with most pension actuaries’ top-down approach of adjusting a standard mortality table based on their current pensioners’ longevity experience.
Club Vita Canada’s approach allows plan sponsors and administrators the ability to use fully credible and up-to-date mortality assumptions tailored to the members in their plans, regardless of the size of the plan’s membership. The process also allows longevity expectations to be determined for current active members who have not yet retired and may have different longevity characteristics than current pensioners. Furthermore, plans can truly understand and assess the longevity risk of their membership through a combination of robust baseline mortality assumptions, longevity trend research and a wide range of longevity risk analytics included in our reports provided to club members.
The dataset
To create a credible dataset (VitaBank), Club Vita Canada’s longevity consultants contacted plan sponsors across Canada. The initial club membership consisted of 43 plans interested in better measuring and managing their longevity risk, covering:
• public-sector and private-sector plans;
• a wide range of industries; and
• Canadians living in all provinces.
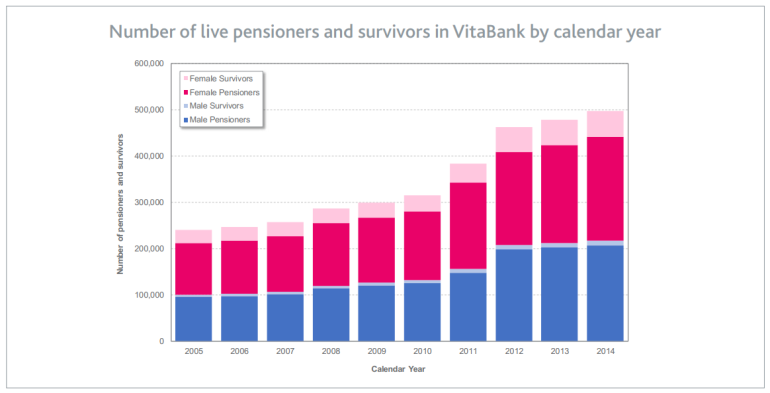
The following graph shows the number of male and female pensioners and survivors in our dataset over the decade ending 2014. Our inaugural study focused on longevity experience over 2012, 2013 and 2014 to determine current longevity expectations (i.e., baseline mortality).
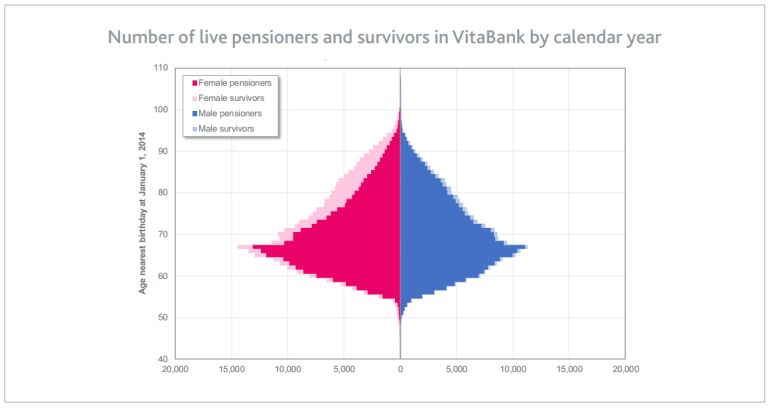
The chart below takes a closer look at the pensioners and survivors alive within VitaBank during 2014. It offers insight into the age distribution of pensioners and survivors, with both male and female pensioners peaking at age 67. Not surprisingly, the distribution of female survivors is more heavily weighted toward older ages, with 50% of female survivors being age 79 or older. The number of male survivors within VitaBank is much smaller than the number of female survivors. But like females, the distribution is more heavily weighted toward older ages, with 50% of male survivors being age 76 or older.
A large amount of data on living and deceased plan members is critical to longevity analysis. At the end of 2014, there were 497,000 living pensioners and survivors in VitaBank. And over all historical years, VitaBank includes approximately 125,000 deaths recorded.
VitaBank is similar in size to the dataset used for the CPM study. VitaBank also has a relatively similar proportion of lives coming from public and private pension plans as that in the CPM study. However, several key differences exist between our data and approach to longevity compared to the CPM study:
• More recent data – We finalized our VitaCurves at the end of 2016 based on experience over 2012 to 2014, whereas the CPM study was finalized in 2014 based on data over 1999 to 2008. By having a dedicated team with specialized longevity data collection and modelling skills, we’ve significantly shortened the time needed to translate mortality experience into expectations. Also, by focusing on a narrower period, we can gain a more appropriate picture of current rates of mortality (i.e., baseline mortality) and have a much better separation between current mortality rates and longevity improvements.
• More diverse plan memberships and range of factors – The plans that participated in Club Vita Canada to date cover a diverse range of member types in aggregate. But we also ensured that large plans didn’t bias our inaugural study results and, as a result, the large plans that participated included a wide cross section of member types. Equally important, we collected a wide range of potential longevity factors. This allowed us to identify the factors mentioned earlier.
• Annual updates and reporting – We perform longevity data collection and modelling every year. This furnishes club members with the ability of staying on top of changes to longevity and minimizes the risk of being caught off guard by changes in expectations. We do this through a combination of detailed reporting covering a wide range of longevity analysis, longevity research projects and thought leadership, and providing each plan with customized VitaCurves.
On top of the advantages above, we employ rigorous data validation processes. This includes over 100 validation tests to ensure we don’t introduce poor quality or biased data into our analysis.
Each year, Club Vita Canada will conduct a new study to give plans the most up-to-date analytics on the life expectancy of their membership and their longevity risk.
Going the distance: Future plans
Each year, Club Vita Canada will conduct a new study to give plans the most up-to-date analytics on the life expectancy of their membership and their longevity risk. Growing the dataset benefits all participants, making the assessment of members’ longevity risk profiles even more accurate.
We will work to continue to advance the measurement and management of pensioner longevity risk through enhancements to our longevity modelling, and the longevity analysis and research we provide to club members.
1 Life expectancies presented in this report are all period life expectancies, that is, without any allowance for future longevity improvements, and coincide with a
base year of 2013.
2 The lower and upper CPM life expectancies have been determined based on the CPM lowest and highest pension size adjustments.
3 Based on experience over years 2012 to 2014 for pensioners and survivors using lifetime pension amounts.
4 Based on using the CPM Private or CPM Public mortality table, depending on the sector of the plan and using the actual and expected pension amounts ceasing due to death.