


Question:
Can sporting world records teach us anything about longevity?
Answer:
The fact that we are asking the question probably gives away the answer: yes they can!
As an example, let’s look at the world record times for the men’s 100m sprint. The chart below plots historical world record times against the date that the record was set. The solid purple line shows the linear trend of the historical records, the dotted line is a projection of this linear trend into the future.


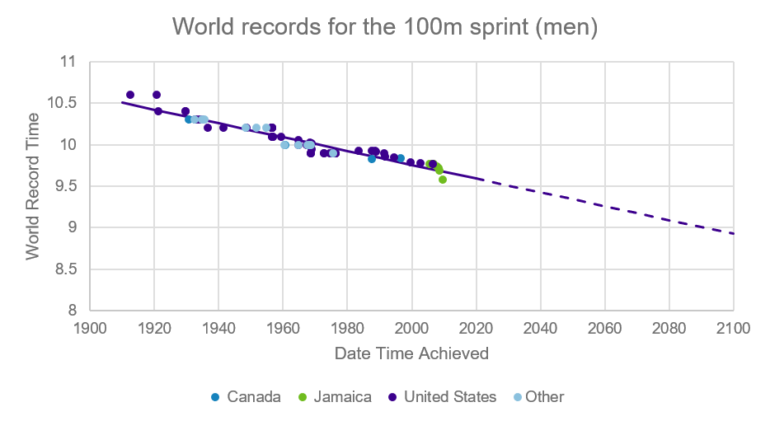
Source: Club Vita presentation of the IAAF men’s 100m ratified world records
If we were asked to predict future records based purely on historical data, we may naturally look to the dotted line to make our predictions. However, we need to be careful when extrapolating the past into the future:
- What were the drivers for the historical improvements in world records?
- Are these drivers still contributing to improvements?
- If previous drivers have been exhausted, will they be replaced by new and similarly effective drivers?
- Is there a natural limit to how fast someone can run 100m?
Improvements due to advances in equipment could well continue, with controversial developments in sprint spike technology expected to contribute to faster times at this year’s Olympics. And there may be headroom in improvements to diet - Usain Bolt famously survived entirely on chicken nuggets at the Beijing Olympics! However, this projection cannot be appropriate to use indefinitely; this method predicts a world record of zero seconds in 3175, which I think we can all agree must be outside the realms of possibility.
The same issues apply when trying to project improvements in life expectancy. Below we plot historical life expectancy world records for women. Each point on the chart represents the longest life expectancy for women seen in any country up to that time. The famous observation of Vaupel and Oeppen in their 2002 paper is that the progression of these life expectancy records follows a linear trend. Again, the solid purple line shows the historical linear trend and the dotted line projects this trend into the future. (This is an example of a regression model, we covered this and other methods for projecting future longevity in our webinar on mortality improvement models).
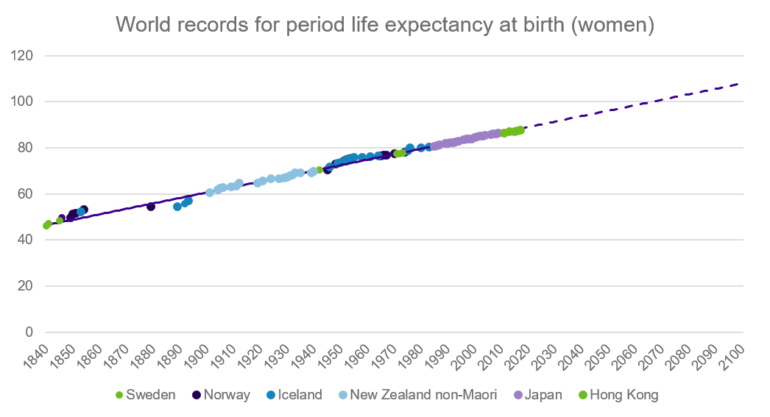
Source: Club Vita analysis of the Human Mortality Database dataset. University of California, Berkeley (USA), and Max Planck Institute for Demographic Research (Germany). Available at www.mortality.org or www.humanmortality.de (data downloaded on 16 July 2021).
Like with sporting records, we need to be careful when extrapolating the past into the future:
- What were the drivers for the historical improvements in world records?
- Are these drivers still contributing to improvements?
- If previous drivers have been exhausted will they be replaced by new and similarly effective drivers?
- Is there a natural limit to how long someone can live (or how long a population can live on average)?
Historical improvements in life expectancy have come from developments in sanitation, advances in medical science (such as the discovery of penicillin) and behavioural changes (such as the decrease in smoking prevalence). But a population can only benefit from these advances once.
The key questions are:
- What are the new drivers of improvements in life expectancy? And will they contribute more, less or similar amounts to improvements compared to historical drivers?
- Is there a natural limit to life, or can we expect increases in life expectancy to continue forever? By the time we conquer special relativity and achieve the instantaneous 100m in 3175, the life expectancy record for women would be over 360 years. Whether that is achievable or not is up for debate.
What do you think?
What do you think?
Let us know your thoughts and comments on this publication on our Friends of Club Vita LinkedIn Group