


This year’s release of the Society of Actuaries’ Mortality Improvement Model (MIM-2026) includes an update to the historical data used in the SOA’s analysis of county-level socio-economic differences in improvements. Even when calibrating improvements to pre-pandemic data, the update may have a bigger effect than you expect.
The SOA’s MIM includes a number of data sets that can be used to model historical mortality improvements and calibrate initial rates in the projection of future improvements:


- Social Security Administration (SSA) data
- Used to calibrate the Retirement Plans Experience Committee’s (RPEC) MP-2021 improvement scale
- National Center for Health Statistics (NCHS) data
- Provided for the aggregated US national population;
- Split by socio-economic quintiles of counties; and
- Split by socio-economic deciles of counties
To avoid volatile mortality rates from the COVID-19 pandemic distorting future improvement projections, calibrations of future projections in MIM-2026 are limited to data through 2019. Given that no new years of data are added to a projection, it’s easy to overlook an important update to one of the data sets.
The NCHS data set uses population estimates rolled forward from the latest available Census by the Census Bureau to generate its mortality statistics (in contrast to the SSA data which uses recorded SSA populations in each year). The NCHS data included in this year’s MIM has been updated for the latest population projections, which now incorporate information from the 2020 US Census. This has resulted in some changes in derived mortality improvements at older ages. 1
Comparison of improvements in the aggregate population data sets (over age 65)
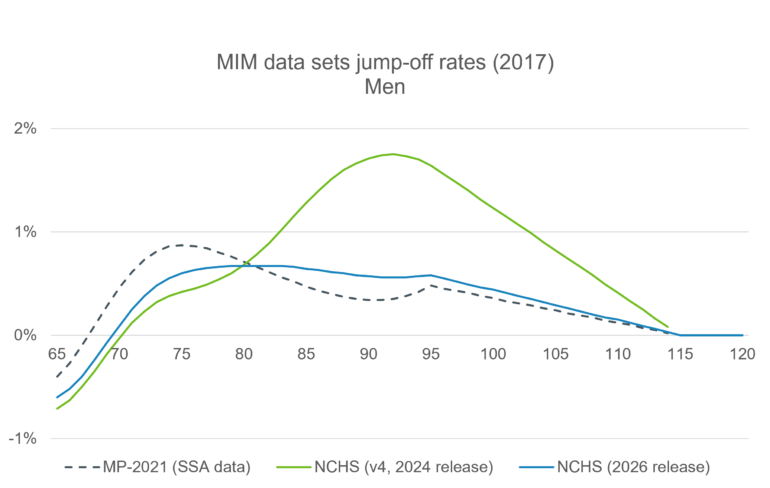
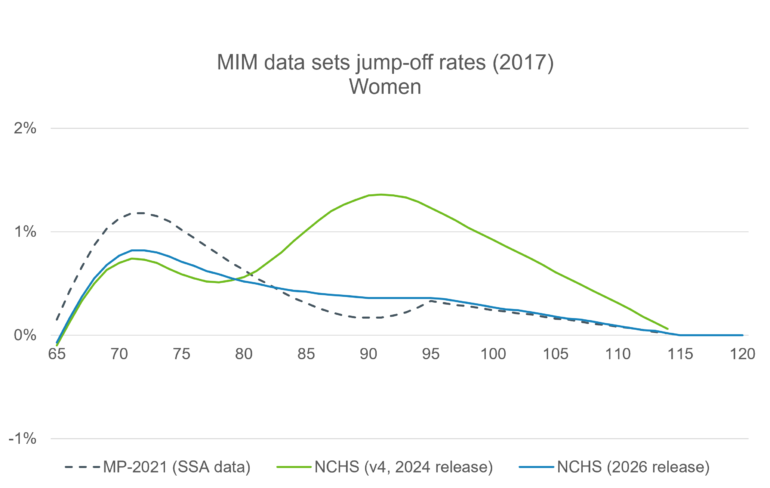
The following charts show the mortality improvements at different ages in the SSA, previous NCHS and updated NCHS data sets for the year 2017 (these are the “jump-off” rates in MIM for future projections, i.e., the latest year of output driven entirely by historical data). The green line shows improvements derived from the NCHS data in the previous release. The blue line shows improvements derived from the NCHS data in the latest release. For reference, the grey dotted line shows improvements derived from the SSA data (and that reflect the improvements in the RPEC’s MP-2021 improvement scale) these have not changed in the recent release.
Source: Club Vita analysis based on output from the Society of Actuaries’ MIM-2026 and MIM-2021 v4
The updated NCHS data gives significantly lower jump-off rates for ages above around 85 (and therefore lower projected improvement rates when calibrating projections to this data set); the updated NCHS data also gives jump-off rates much more in line with the SSA data at older ages, although for ages 65 to 80, lower levels of improvements persist.
The table below compares a range of actuarial calculations for retirees using improvement scales calibrated to these data sets. Updating calibration data from the previous to the more recent NCHS data would decrease life expectancy for retirees by 1%-5%, with the greatest impact for older retirees.
| Men | Women | ||||
SSA | NCHS | NCHS | SSA | NCHS | NCHS | |
Life expectancy (65) | 20.8 | 21.0 | 20.8 | 22.8 | 23.0 | 22.7 |
Life expectancy (75) | 12.9 | 13.1 | 12.9 | 14.3 | 14.6 | 14.3 |
Life expectancy (85) | 6.6 | 7.1 | 6.7 | 7.6 | 8.1 | 7.7 |
Age standardized improvement rate | 0.7% | 0.6% | 0.5% | 0.4% | 0.4% | 0.3% |
Source: Club Vita analysis based on output from the Society of Actuaries’ MIM-2026 and MIM-2021 v4. Life expectancy is cohort life expectancy using date of calculation 1 January 2026 and improvements calibrated using MIM to the relevant data sets. Age-standardization calculated over the American Community Survey 2010 population.
Impact on improvements calibrated to socio-economic groups
One of the key features of the NCHS data is that ongoing Society of Actuaries’ research has subdivided the data set into county-level deciles by socio-economic status and identified higher levels of mortality improvements for the higher socio-economic deciles over the last 40+ years.
The MIM includes an option to calibrate future improvement assumptions using mortality data split by these socio-economic deciles (or any proportionate weighting of them). The update to the Census Bureau’s population estimates also affects this socio-economic breakdown of the NCHS data.
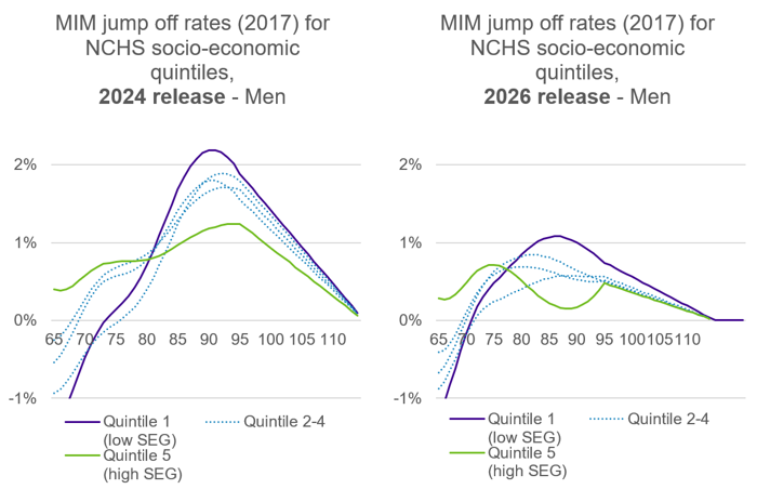
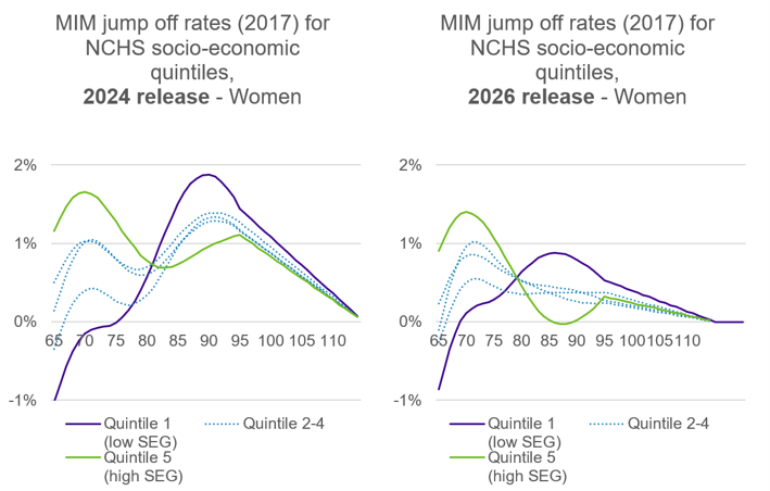
The charts below show the jump-off rates in MIM for the different socio-economic quintiles of NCHS data in the different MIM releases. The reduction in older age improvements from the 2024 to the 2026 release has affected all socio-economic quintiles of the data. In both releases, the difference in recent improvements between socio-economic quintiles actually differs by age, with younger ages seeing higher improvements for higher socio-economic groups, and older ages seeing higher improvements for lower socio-economic groups.
Source: Club Vita analysis based on output from the Society of Actuaries’ MIM-2026 and MIM-2021 v4
The tables below compare a range of actuarial calculations for retirees using improvement scales calibrated using MIM to the highest and lowest socio-economic quintiles in the different NCHS data releases. Directionally we see similar results over the different data releases: cohort life expectancy is slightly higher for higher socio-economic groups for younger retirees (65-75) and slightly higher for lower socio-economic groups for older retirees (over age 75). The magnitude of these differences changes a little between data releases.
Men | NCHS 2024 release | NCHS 2026 release | ||||
Quintile 5 (high SEG) | Quintile 1 (low SEG) | Q5/Q1 Diff’nce | Quintile 5 (high SEG) | Quintile 1 (low SEG) | Q5/Q1 Diff’nce | |
Life expectancy (65) | 21.3 | 20.9 | +2% | 20.9 | 20.7 | +1% |
Life expectancy (75) | 13.2 | 13.2 | 0% | 12.8 | 12.9 | -1% |
Life expectancy (85) | 7.0 | 7.3 | -4% | 6.6 | 6.9 | -4% |
Age standardized improvement rate | 0.7% | 0.2% | 0.5% | 0.4% | 0.2% | 0.2% |
Women | NCHS 2024 release | NCHS 2026 release | ||||
Quintile 5 (high SEG) | Quintile 1 (low SEG) | Q5/Q1 Diff’nce | Quintile 5 (high SEG) | Quintile 1 (low SEG) | Q5/Q1 Diff’nce | |
Life expectancy (65) | 23.4 | 22.8 | +3% | 22.9 | 22.6 | +1% |
Life expectancy (75) | 14.7 | 14.6 | +1% | 14.3 | 14.3 | 0% |
Life expectancy (85) | 8.0 | 8.3 | -4% | 7.6 | 7.9 | -4% |
Age standardized improvement rate | 1.2% | 0.1% | 1.1% | 0.9% | 0.2% | 0.7% |
Source: Club Vita analysis based on output from the Society of Actuaries’ MIM-2026 and MIM-2021 v4. Life expectancy is cohort life expectancy using date of calculation 1 January 2026 and improvements calibrated using MIM to the relevant data sets. Age-standardization calculated over the American Community Survey 2010 population.
What does this mean for pension plans and insurers?
For pension plans and insurers that use the Society of Actuaries' Mortality Improvement Model, the latest release is a reminder that changes in underlying population estimates can have unexpected impact on projected longevity, even when no new years of mortality experience have been added to the model.
The revised NCHS data results in lower historical mortality improvements at older ages relative to previous MIM releases. For users calibrating assumptions directly to the NCHS data, this translates into lower projected life expectancies and longevity-related liabilities, particularly for older pensioners and annuitants. The update also reduces some of the divergence previously observed between the NCHS and SSA-based improvement data at advanced ages. Organizations that have viewed the differences between these data sources as a source of model uncertainty may take some comfort from the greater consistency now evident in the latest release.
For users of the socio-economic functionality within MIM, the broad conclusions of the SOA's research remain unchanged. Higher socio-economic groups continue to exhibit stronger improvement rates at younger retirement ages, while the pattern reverses at older ages, although the magnitude of differences between socio-economic groups has shifted somewhat.
1 The 2010 Census seems to have overestimated the US population in age bands above age 80. This created so-called “phantom cohorts” of non-existent people working through the population projections following 2010. As no-one in these phantom cohorts died (as they didn’t really exist), their mortality rates were effectively 0% year after year. As they became larger proportions of the overall population as years progressed, they contributed to higher modeled mortality improvements at those older ages than were actually experienced by the population.