


This is an update of our analysis of state-level excess mortality data up to December 31, 2023 (data available as at February 27, 2024). COVID-19 deaths persist, but total deaths have dropped to levels broadly in line with pre-pandemic trends. Has society now adjusted to living with the virus as part of everyday life?


We present charts for each state through December 31, 2023 in the appendix (downloadable PDF below). You will be able to spot the few states still with reporting delays.
Current position of the US
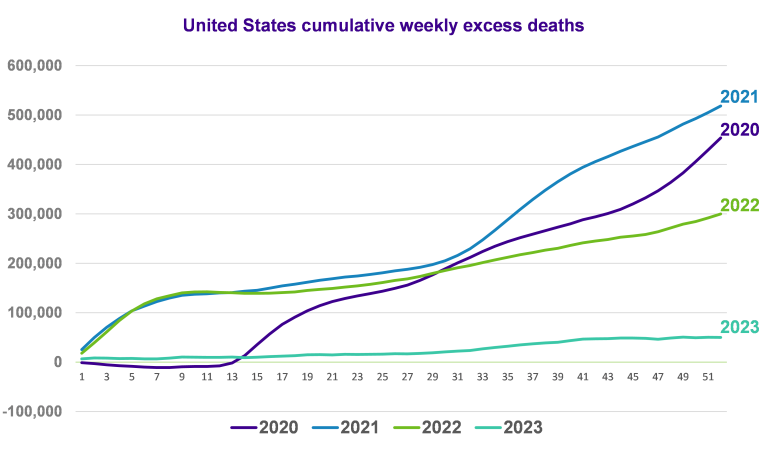
The chart below illustrates the cumulative weekly excess deaths in the United States spanning from 2020 to 2023. Excess deaths are a comparison between actual deaths and the calculated expected deaths for each respective year. Expected deaths are determined by linearly extrapolating data from 2015 to 2019 to each year during the pandemic, resulting in an approximate 1.3% increase in expected deaths per year. Given the ongoing growth and continued aging of the United States population, it is natural to anticipate a slight increase in the number of expected deaths annually, assuming all else being equal.
The purple line shows the 2020 experience, the blue line shows the 2021 experience, the green line shows the 2022 experience, and the turquoise line shows the 2023 experience. Each year’s data presents distinct patterns. Allowing for the upward trend in expected deaths due to the aging population, we saw approx.116% of expected deaths in 2020, approx. 117% in 2021, approx. 110% in 2022 and approx. 102% in 2023.
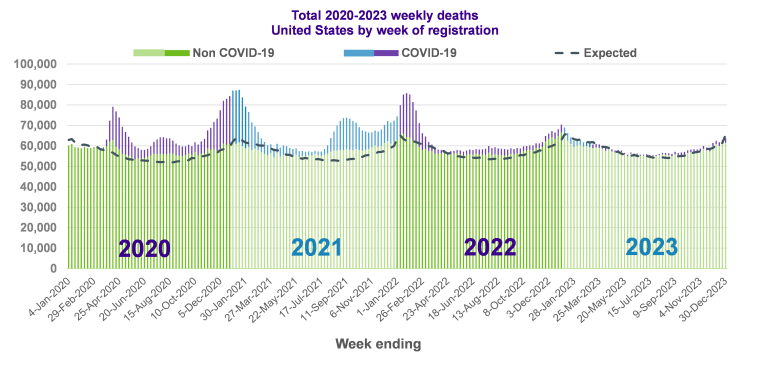
The next chart shows the number of deaths registered in the US each week from the week ending January 4, 2020 through the week ending December 31, 2023. The purple and blue bars show deaths recorded as COVID related, and the green bars show other deaths. The dotted line shows the average number of deaths for each week of the year based on the previous five years.
The chart illustrates a pattern of excess deaths recorded above expected levels from late February 2020 through the end of 2022, presenting five distinct waves of mortality. Each wave impacted different regions of the country with varying intensity. The first wave during spring 2020, was felt the hardest in New York, its surrounding areas and other metropolitan hubs like Boston. The second wave during summer 2020, was most harshly felt in the southern ‘sunshine belt’ states. The third wave in winter 2020/21, was felt right across the US, with only Hawaii not seeing significant COVID-19 deaths in this period. The fourth wave in fall 2021 coinciding with the spread of the delta variant, was felt the hardest in the southern states. The fifth wave in winter 2021/22 coinciding with the spread of the omicron variant, affected many states across the US, with a particularly notable effect in the Midwest. After the fifth wave subsided, we have not seen another prominent wave of deaths. Most notably, a summer wave in the southern states, as seen in 2020 and 2021, did not materialize to the same extent in 2022. Instead, the remainder of 2022 resulted in low, but steady excess deaths across most of the country, with heightened experience in the West.
In 2023 the nation experienced a notable shift in the mortality trend compared to the preceding years of the pandemic. Unlike the distinct waves of excess deaths observed in previous years, 2023 marked a period of relative stability in mortality rates across the country. The absence of a prominent resurgence in COVID-19 cases led to a decline in excess deaths, with the actual deaths being approximately equal to what was expected.
In this article we will use similar charts to explore how the pandemic has spread across the US and how different states have been affected differently depending on when outbreaks first occurred.
The 5 waves
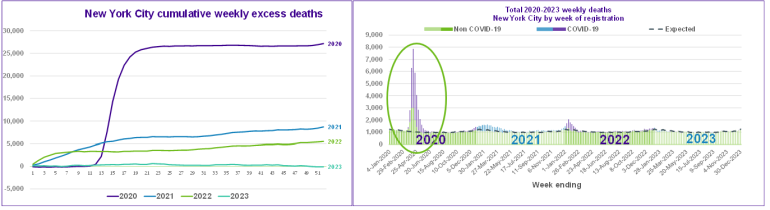
Wave 1 – spring 2020: New York, its surrounding area and other metropolitan hubs
New York City
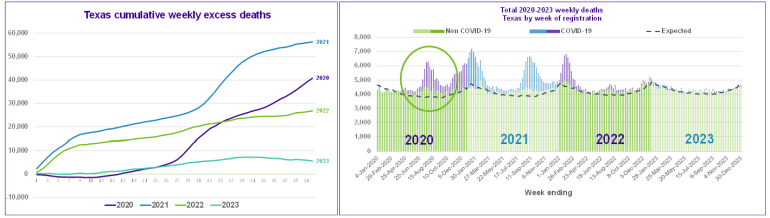
Wave 2 – summer 2020: the sunshine belt
Texas
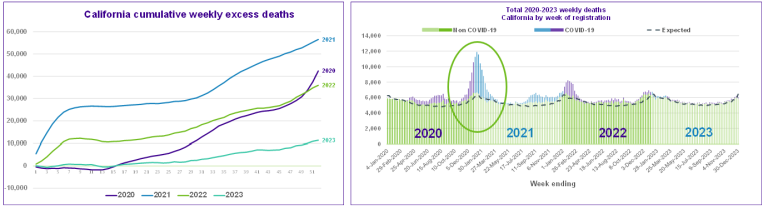
Wave 3 – winter 2020/21: everywhere (apart from Hawaii)
California
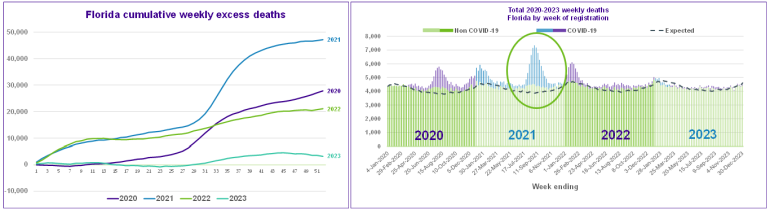
Wave 4 – fall 2021 (delta): the South
Florida
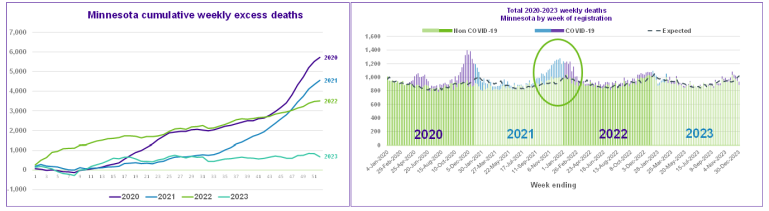
Wave 5 – winter 2021/22 (omicron): everywhere (including Hawaii!)
Minnesota
What’s next?
As we move through 2024, the COVID-19 narrative has transitioned from a pandemic to an endemic phase. Excess deaths have dwindled to a level nearly on par with pre-pandemic trends. The CDC has lifted the 5-day isolation guidelines. However, daily deaths continue to hover around 250 per day (as of March 4th). Will one of the ever-growing number of COVID variants surge into the system as a new wave or will new variants reduce in potency? Will long-COVID begin taking an even greater toll on our long-term health or will we see an emerging survivorship effect in population? As we look into the future, attention has shifted to regional disparities in COVID experiences across the country. Different parts of the country have encountered the virus in distinct ways, highlighting the need for more localized responses moving forward.
The source for all the data used in this article is the National Center for Health Statistics Mortality Data on CDC Wonder
How different states have experienced COVID-19 through December 31, 2023
Update of our analysis of state-level excess mortality data up to December 31, 2023