


SOA’s PUB-2016 mortality tables confirm longer lifespans…just not as much as previously predicted
The Society of Actuaries (SOA) Research Institute’s Retirement Plans Experience Committee (RPEC) released the Pub-2016 Mortality Table Draft Exposure Report in January 2025, providing updated mortality tables for U.S. public pension plans. The tables were developed based on data from 2013 through 2019. Data from 2020 was collected, but ultimately the decision was made to exclude it due to the COVID-19 pandemic. The study confirms that while life expectancies have continued to rise, the rate of improvement has slowed, and in most cases has been lower than that assumed by commonly used mortality improvement scales such as MP-21. Teachers continue to show the longest lifespans, followed by General Employees and Public Safety workers. Compared to the Pub-2010 series of tables, the new tables generally result in slightly lower annuities, although adjustments to base tables based on plan experience will likely cancel out most of these differences for many larger plans.


The SOA is accepting comments on the draft through March 2025, with final tables expected later in the year.
Below are some highlights of the PUB-2016 tables compared with the previous PUB-2010 tables.
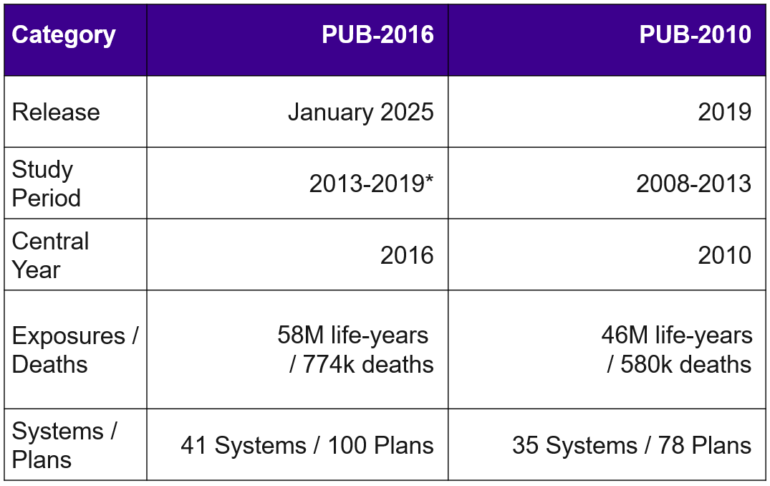
*2020 data was collected for the PUB-2016 study. It was ultimately excluded to prevent distortions from any pandemic related experience.
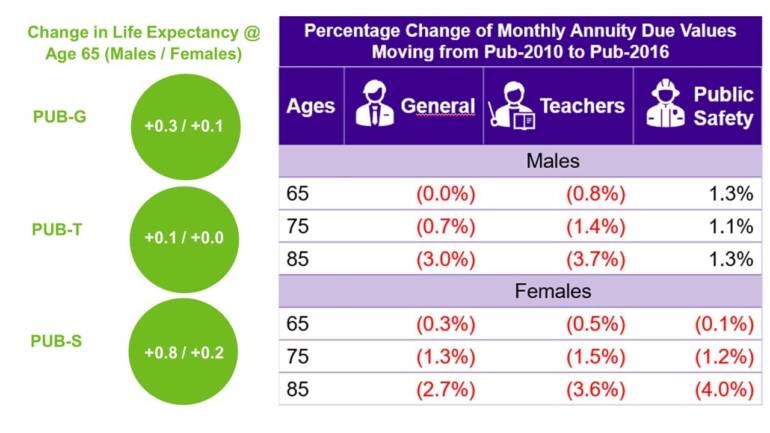
Impact on Life Expectancy (Annuities)
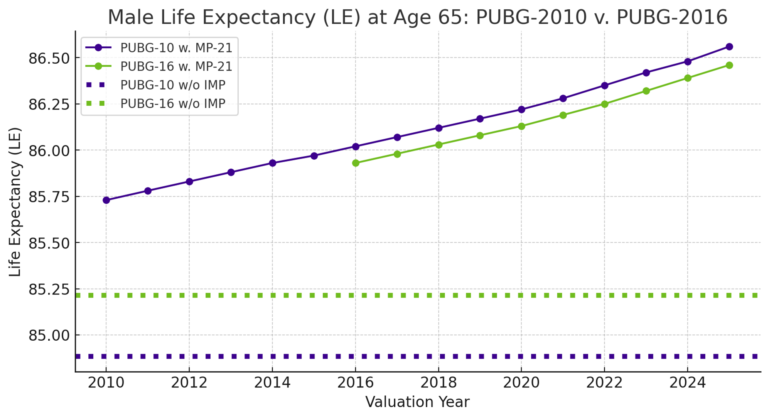
The updates from Pub-2010 to Pub-2016 mortality tables reflect continued increases in life expectancy; however, improvements between the models have not been as high as projected by the MP-2021 improvement scale. This is likely due to a change in make-up of the underlying data between the two models, or perhaps due to public sector workers seeing slower mortality improvements than the general population over the period 2010-2016.
As a result, annuities have generally decreased when transitioning tables. Life expectancies for male public safety employees have outpaced improvement projections leading to increased annuity factors. The exhibits below shows comparisons of life expectancies and annuity factors moving from the Pub-2010 to the new Pub-2016 tables for each respective occupation type.
Other Considerations
- Geographical & Socioeconomic Drivers: The Pub-2016 tables are based on averages of public sector data across the country (driven by which plans contributed to each model calibration). They do not account for differences in mortality that can arise from geographical or socioeconomic factors. As always, it’s important to consider how your plan differs from national averages when assessing if and how to make adjustments to the new tables to reflect plan demographics.
- Cashflows & Duration: As seen in the chart above, the change in mortality rates under the Pub-2016 tables is not uniform across ages. The new tables show larger reductions in annuities at older ages (i.e., at ages above 75). This may result in a shorter duration of cashflows, which should be considered when formulating risk management and investment strategies. This impact will remain, even if adjusting tables for a plan’s own experience.
Download the PDF of this article
Club Vita Summary: Society of Actuaries’ PUB-2016 Report (Exposure Draft, Jan 2025)