


Question:
What was the level of excess mortality in the US in 2022?
Answer:
Over the whole of 2022 we saw around 10% more deaths in the US than expected based on pre-pandemic trends. This was a reduction from around 16% in 2020 and 17% in 2021. However, these excess deaths did not occur uniformly across the year.
The purple bars in chart below show the percentage increase (or decrease) in deaths in each week of 2022 compared to the 2015-2019 trend. For comparison, the light blue bars show the number of deaths that occurred in each week that were recorded as COVID-19. As you can see, not all excess deaths were recorded as COVID-19.

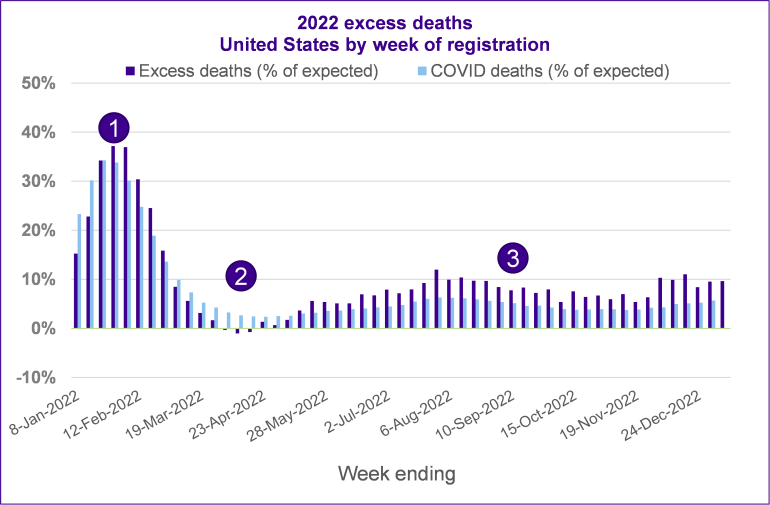
Source: Club Vita calculations and presentation using CDC weekly death data for 2022 available as at February 23, 2023. Expected deaths are calculated as the continuation of the linear trend in 2015-2019 deaths.
Key takeaways:
Over the whole of 2022, we saw 10% excess mortality across the US. This can be split up into three distinct periods:
- January and February saw high levels (26%) of excess deaths, coinciding with the omicron wave of the COVID-19 pandemic.
- March and April saw lower levels (1%) of excess deaths, possibly due to a displacement of deaths to the earlier part of the year.
- May to December saw persistent moderate levels (8%) of excess mortality. During this period only 59% of the excess deaths were recorded as COVID deaths
The key questions are:
- What caused these excess levels of mortality and are they likely to continue?
- We explored this question in detail with a panel of industry experts in our recent Club Vita webinar. If you’d like to catch up on that webinar, you can find a recording here.
- Will 2022 data be representative of the future?
- We asked this question to the audience of our recent webinar (made up of nearly 300 people primarily working in the US pension and insurance industries). 63% indicated that they thought some 2022 data would be representative of the future – 7% saying the whole year, and 56% saying only the May to December period.