


Question:
What does the CDC provisional 2025 death data tell us about recent retiree mortality?
Answer:
From the provisional death data published by the CDC in July 2026, 2025 looks to have been another light year of mortality for retirees in the US, with the lowest level of age-standardized mortality rates for 65-95 year-olds on record and mortality improvements from before the pandemic returning.
The charts below show the progression of age-standardized mortality rates for 65-95 year-olds in the US since 2010, including 2025 based on provisional CDC death data. The grey and turquoise lines show different projections for the progression of mortality rates based on pre-pandemic trends. For both men and women, provisional 2025 mortality rates are the lowest they have ever been. For women, 2025 mortality rates are now broadly in line with pre-pandemic trends. And for men 2025 mortality rates are now lower than those projected by pre-pandemic trends.

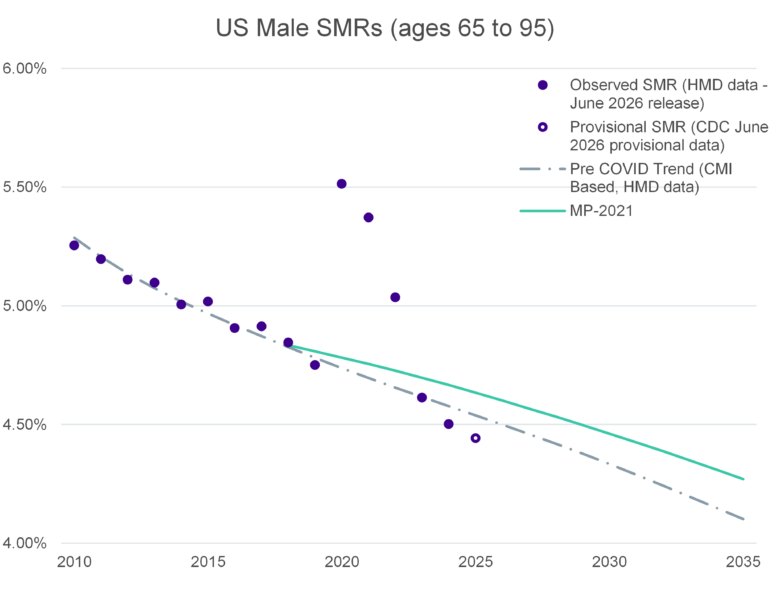
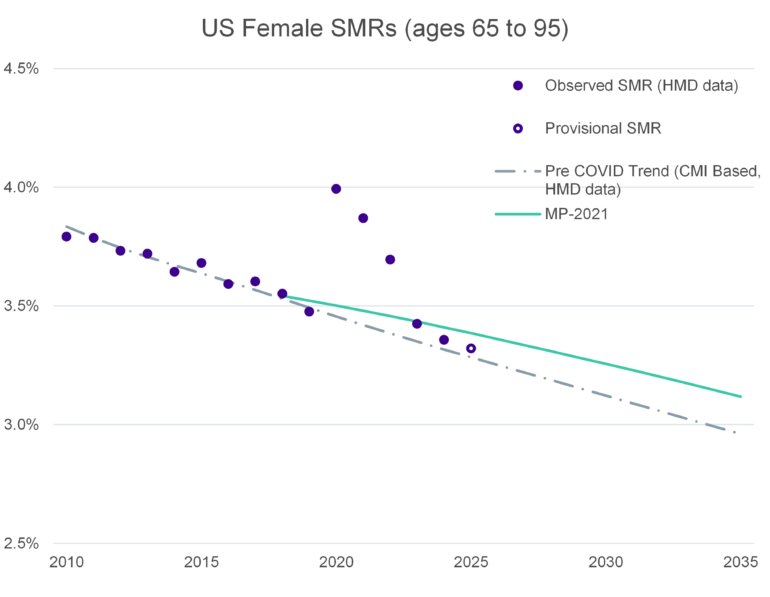
Sources: 2010-2024 figures are based on Human Mortality Database’s June 2026 release of US exposure and death data. 2025 figure based on CDC Wonder’s July 2026 publication of provisional 2025 death data and exposures derived from Human Mortality Database’s June 2026 release of US population data. Pre-COVID trend is based on the CMI_2024 model calibrated to the pre-2019 data with a long-term rate of 1%. MP-2021 trend is based on the Society of Actuaries MP-2021 Mortality Improvement Scale applied to the 2017-2019 average mortality rates. Mortality rates shown are age standardized over ages 65 to 95.
Key takeaways
• For both men and women, provisional 2025 mortality rates are the lowest they have ever been.
• For women, 2025 mortality rates are now broadly in line with pre-pandemic trends.
• For men, 2025 mortality rates are now lower than those projected by pre-pandemic trends.
The key questions are:
- Have we returned to a stable period of mortality trends after the volatility of the COVID-19 period?
- Or, are we still witnessing a transitory effect of the pandemic, such as a temporary period of lighter morality driven by a survivorship effect?