


In August 2024, the National Association of State Retirement Administrators (NASRA) released a comprehensive survey outlining the mortality assumptions used by many of the largest public pension systems in the United States.
To help put these assumptions into context, Club Vita modeled the life expectancy (LE) at age 65 for both males and females based on each system’s reported assumptions. Our modeling incorporates base mortality tables, improvement scales, and any scaling factors or adjustments applied. The results offer a powerful lens through which to examine how different plans view longevity, and how those assumptions compare to one another and to national averages.
This initial release includes 157 unique mortality assumptions across 148 public pension plans & systems, each split by gender and categorized by geographic region and employment type (General, Teacher, or Public Safety).
Below is a snapshot of the modeled life expectancy assumptions for General employee plans, which represent 76 of the 157 assumptions across 67 retirement systems from state, local, municipal, and other public sectors. While the range of assumptions may appear narrow at first glance, the chart below tells a deeper story:


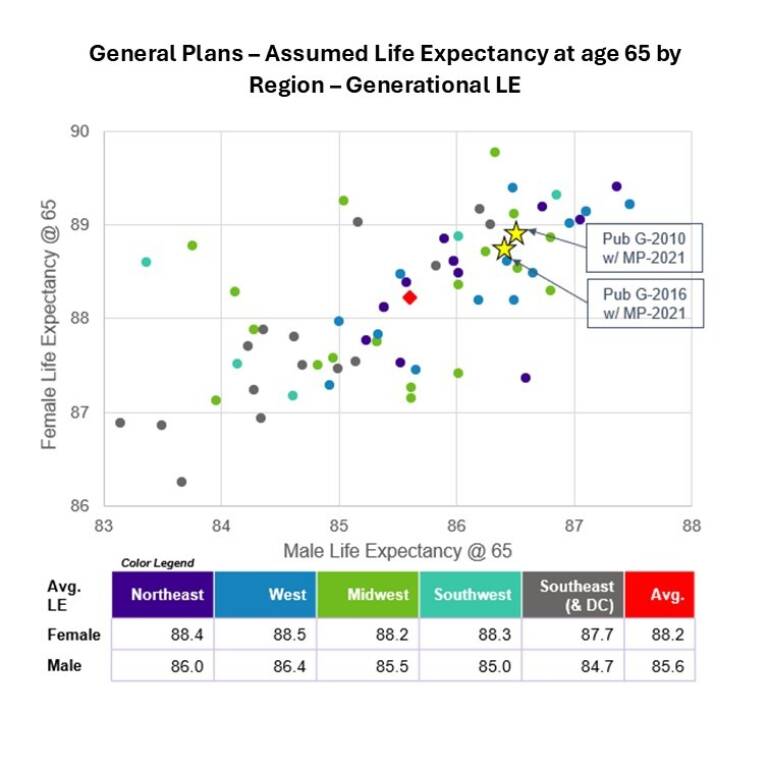
Source: Club Vita modeled LE using NASRA 2025 Assumption Survey; Assumptions use plan-specific base mortality and improvement scales; Calc year = 2024
This chart highlights how public plan assumptions often reflect shorter lifespans than the SOA’s Pub-2010 and Pub-2016 baseline tables (denoted by stars). It also shows how regional patterns in actual longevity don’t always translate into assumption-setting, and how assumed life expectancy can vary by as much as 4.5 years for males and 3.5 years for females, even within a single employment category.
In addition to modeled life expectancy, the report also provides detailed benchmarking on the mortality tables and improvement scales public plans are using, including how frequently each is adopted and whether adjustments, such as scaling factors or set-forwards/set-backs, are applied.
More detailed charts and statistics can be found for the General, Teacher & Public Safety Plans in the report.
Key Questions to Ask
- Is your plan’s assumption in line with peers - or an outlier?
- Are you assuming more (or less) longevity than similar systems?
- Do your tables reflect the actual demographics of your membership?
- How would your plan’s assumptions show up on this chart?
- And most importantly, is your plan keeping pace with emerging best practices?