


As carbon emissions continue to grow, scientists are trying to understand the potential impacts of future climate change scenarios on health.

To encourage consistency in impact modelling of future climate change, in 2007 the Intergovernmental Panel on Climate Change (IPCC) encouraged the scientific community to develop a common set of future climate change scenarios. The result, after a review of 324 different climate scenarios, was the development of four Representative Concentration Pathways (RCPs), which were considered fully representative of the range of emission scenarios available in the literature. Rather than being based on any specific climate change policy, the pathways represent trajectories to various climate change related outcomes by the year 2100. New research has looked at the potential outcomes on health of the emission levels of the different RCPs.
So, what are the pathways?
The RCPs model the concentration of emissions in the air and the resultant level of global warming. In fact, the numbers in each RCP’s name refers to the ultimate radiative forcing level in 2100 as measured in watts per square metre. Radiative forcing is a measure of the heating power flowing from the sun to the Earth minus the power reflected back from the Earth. It measures the impact of human activities on the planet’s climate including the impact of greenhouse gases and deforestation. The current level of radiative forcing is 1.6 W/m2. Which means the earth absorbs 800 terawatts (or 8x10¹⁴ Joules per second) of heating power from the sun. The greater the value of the RCP, the greater the level of global warming. Descriptions of the RCPs are as follows:
RCP 2.6
Radiative forcing peaks at about 3W/m2 before 2100 but will fall to 2.6W/m2 by 2100. This pathway represents scenarios with stringent climate policies that significantly reduce emissions.
RCP 4.5
In 2100 radiative forcing will be 4.5W/m2. This pathway represents most scenarios including many of those proposed by climate policy and low-emission efforts.
RCP 6
In 2100 radiative forcing will be 6W/m2. This pathway represents most scenarios where there is no climate policy.
RCP 8.5
Radiative forcing will rise to 8.5W/m2 by 2100. This pathway leads to the 90th percentile for greenhouse gas concentration and represents the high range of non-climate policy scenarios.
What do these models mean for longevity?
Air pollution from fine particulate matter (PM2.5) and ground level ozone affects people’s health and will contribute an increase in mortality rates. PM 2.5 is associated with premature death for people with heart or lung disease as well as heart attacks, irregular heartbeat, and respiratory symptoms. Ozone can irritate the lungs and aggravate respiratory illnesses like asthma. R.A Silva et al evaluated the future trajectories of ambient PM 2.5 and ozone in the different RCP scenarios, and measured their resultant effects on mortality. A summary of their results are shown below
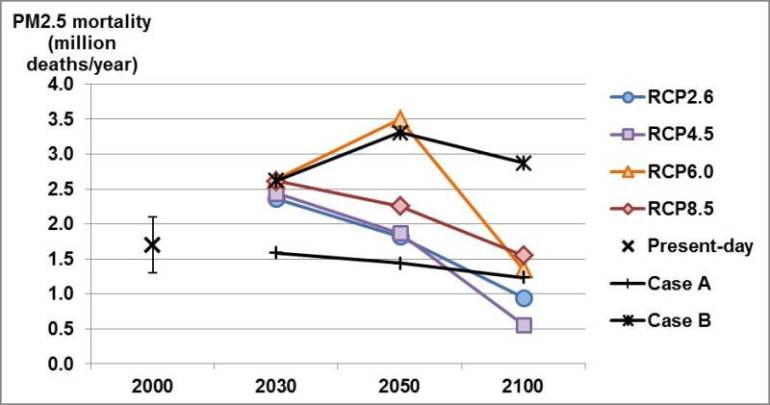
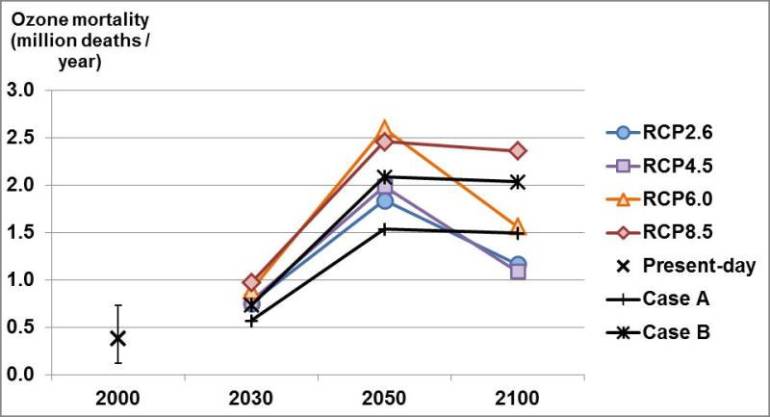
Note: Both of the graphs above depict the death burden of PM 2.5 and ozone. The growth in mortality up until 2050 is partially driven by population growth.
The mortality rates above are linked to the concentrations of PM 2.5 and ozone associated with each pathway. As the concentrations, get higher so do the mortality rates. The trend with ozone mortality is pretty clear; the RCPs with more stringent pollution controls (2.6 and 4.5) have lower mortality rates than those without (6.0 and 8.5). Additionally, it’s worth noting that regardless of the RCP, mortality from ozone in 2100 will be more than it was in 2000. In contrast, regardless of RCP, PM 2.5 mortality is expected to be less than that in 2000. The declining trend in mortality for both ozone and PM2.5 is because the RCPs do account for economic development, and more economically developed countries reduce their air pollution. Thus, as the world’s economy continues to develop, global PM2.5 pollution is predicted to fall regardless of pathway.
What does this mean for pension plans and insurers?
The Representative Concentration Pathways account for climate mitigation efforts. RCPs that lead to lower PM 2.5 and ozone mortality, RCP 2.5 and 4.6, require climate policy and low-emission efforts. Additionally, all of the concentration pathways account for human action to change with economic development. The downward trend in both PM 2.5 and ozone mortality are due to eventual reductions in pollution on account of economic development. These reductions are necessary for these predictions to hold so actions must be taken to invest responsibly to make sure that these RCP predictions can hold.
Which RCP we end up taking has the potential for very large long term effects on pension plans and insurers. We covered some potential mortality scenarios in our Hot and Bothered paper and there also are large implications for investment portfolios and the viability of many plan sponsors. Climate change scenarios should be considered as a central part of future risk management strategies.
What do you think?
We are hopeful that we can follow the lower emission pathways, as we have seen nations that used to be large sources of air pollution cut back once they gained the economic power to do so. China is following an Air Pollution Action Plan and has significantly reduced their PM 2.5 concentrations. This policy came into effect in response to the 1.1 million premature Chinese deaths due to air pollution and the $37 billions of crop failure. Additionally, many other countries are viewing the health effects of pollution as public health issues. China, India, and Singapore are refusing to accept plastic waste from countries like Canada, the UK, and the US. As the global economy develops, more countries may refuse to create pollution to maintain the West’s level of consumption. Can the West adapt and reduce its consumerist habits?