


How long people are expected to live (their longevity) is a crucial assumption for actuaries calculating the future liabilities of pension plans and books of life or health insurance policies.

Actuaries typically split the calculation of longevity into two parts:
Baseline / current longevity: Baseline longevity is a measure of how long people will live if nothing changes in the future (for example, no medical advances or changes to lifestyle). When calculating how long you expect people to live, a good strategy is to first calculate baseline longevity as accurately as possible, and then overlay an assumption of how things will change in the future.
Improvements / trends: The reduction of mortality rates over time. Usually refers to reductions that are projected to happen in the future.
The most common method used to capture improvements by US pension actuaries is the Society of Actuaries’ mortality improvement scale (the MP scale). In this blog I explore some of the considerations arising from the most recent release, MP-2020.
Projecting changes in life expectancy
David Sinclair, the Harvard geneticist and co-author of the book Lifespan believes the first person to live to 150 may be already alive today. He identifies several promising medical advances expected over the coming decades. Using “conservative” estimates at each step along the way, Dr. Sinclair expects 113-year lifetimes to become normal:
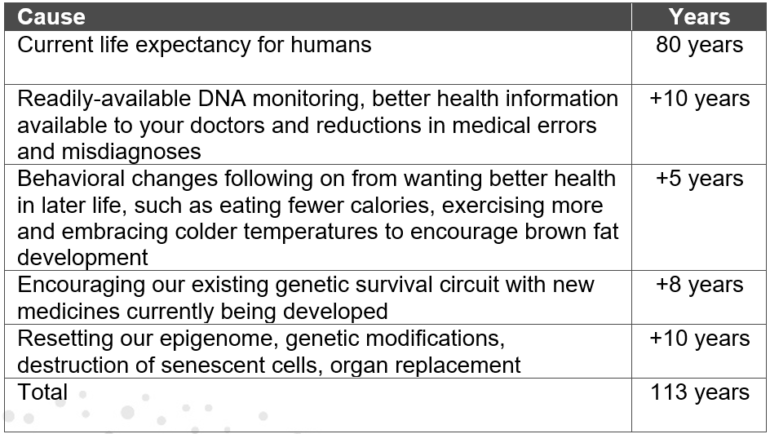

I am glad I picked up and read this book for the first time in 2020. Dr. Sinclair’s optimism has tempered the pessimism brought on by the COVID-19 pandemic that has claimed close to 250k lives in the US through November 16th (with closer to 350k excess deaths of all types). That said, the long-term effects of COVID-19 may diminish Dr. Sinclair’s optimism.
Actuarial profession’s approach to measuring changes in life expectancy for pension plans
Since 2014, the Society of Actuaries’ (SOA’s) Retirement Plans Experience Committee (RPEC) has been releasing annual mortality projection scales (MP-scales), designated by the year they are released (MP-2020 was just released last month). These scales are used to project how life expectancy will change in the future by looking at recent and long-term historical experience. In contrast to Dr. Sinclair’s expectation of revolutionary and quickly-realized life expectancy increases, these SOA mortality projection scales assume a long, slow change in life expectancy into the future.
As you might imagine, this is an important assumption when calculating how much to set aside for defined benefit pension plan participants to save for pensions paid over their lifetimes.
The SOA’s paper can be found here: https://www.soa.org/globalassets/assets/files/resources/experience-studies/2020/mortality-improvement-scale-mp-2020.pdf
A simplified way of thinking of the MP-2020 scale is by looking at three projection periods:
- Knowable near-term: Projection of the mortality base table (Pri-2012 is based in 2012, Pub-2010 is based in 2010) using known mortality experience at a population level. This is the purple section in the chart below
- Projected near-term: Projection between the known population mortality experience to some point after the valuation date reflecting the knowable near-term info while preparing for smoothing into long-term rates. This is the blue section in the chart below.
- Long-term: The relatively subjective long-term improvement rate assumption. This is the green section in the chart below.
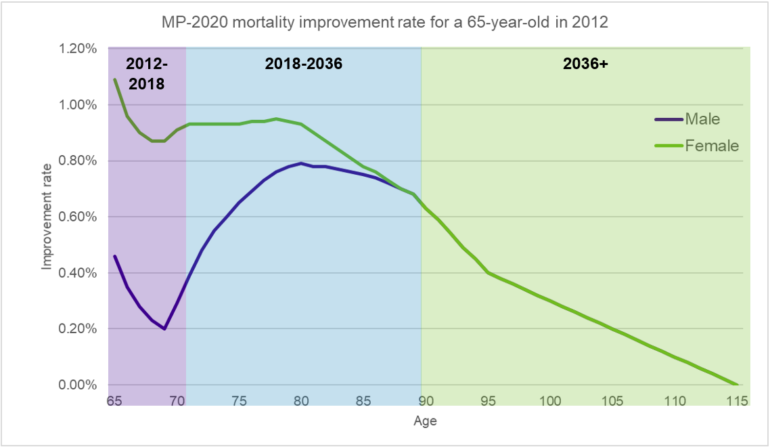
Where the improvement rate is above 0%, next year’s mortality rate decreases. Decreases in annual mortality rates lead to longer lives, so positive improvement rates result in longer lives in the model above. Conversely, if improvement rates are negative, mortality rates go up and life expectancy goes down.
Main changes in the MP-2020 model:
The recent MP-2020 release has seen some changes being incorporated into the 2020 version of the MP model, including:
- The model now includes an extra year of historical mortality data from the Centers for Disease Control and Prevention (CDC) – now through 2018.
- We note, there is a delay in reliable mortality data from the CDC, which is why there is a significant delay in this part of the projection scale. MP-2019 included data up to 2017.
- This is what underpins the starting rates for the improvement scale (the purple and blue sections of the improvement rate chart above).
- There are two generational groups that start the improvement scale assuming shorter life expectancies in the near-term than other cohorts: people under age 50 and in their early 60s as of 2020. Contributing factors to this experience could be attributed to the recent increase in opioid deaths for the younger group and generational echoes of the AIDS epidemic for the older group.
- The update to include 2018 data reduces liabilities by 0.2-0.4% for men and 0.0-0.4% (depending on age profile) for women compared to MP-2019.
- The long-term rate (green section of the improvement rate chart above) has been updated to allow for an age effect of improvements seen in historical data.
- RPEC has looked at historical Social Security data and concluded that there is an age effect on long term improvement rates, with noticeably lower improvements over the long term for people over 65 years of age relative to those under 65.
- RPEC has adopted these as the new long-term rates.
- The update to the long-term rate reduces liabilities by 0.0-0.6% for men and 0.3-0.7% for women (depending on age profile) compared to MP-2019.
- The figure below from the MP-2020 report compares the new and old long-term improvement rates:
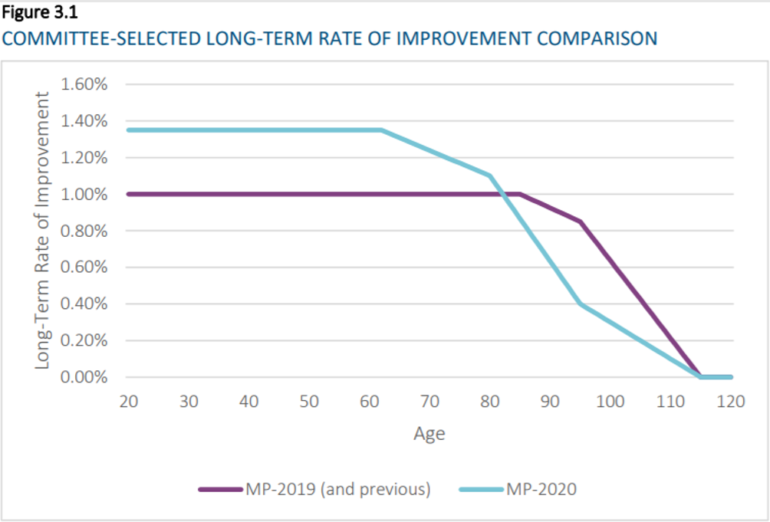
- The effect of this lower long-term improvement rate for later ages will reduce pension plan obligations for all but the youngest participants.
- COVID-19
- No allowance for COVID-19 has been made in the MP-2020 model.
- Data for 2020 will not be incorporated into the MP improvement models until 2022.
The report acknowledges COVID-19 is a significant event and an actuary (or plan sponsors for financial reporting purposes) may wish to reflect it. The paper provides some computational guidance for how to adjust one year of improvements in the model to allow for COVID-19 experience.
Where to next?
Some considerations when applying the MP improvement scale to a pensioner population:
- Regarding COVID-19:
- Before concluding that the MP-2020 improvement scale is appropriate for a given purpose, an actuary should consider the balance of possible positive and negative effects of COVID-19 on mortality improvement rates in the near, intermediate and long term.
- Pension plans and their advisors should discuss this information (maybe with the help of scenario modeling) and document the results of their discussions rather than routinely taking the MP-2020 model built on 2018 data.
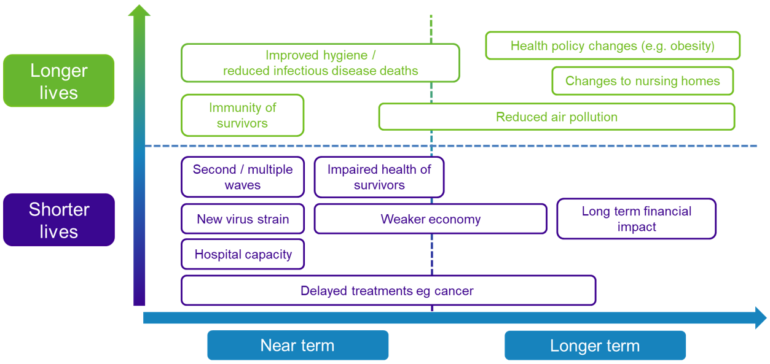
- The chart below shows how we have been thinking through the potential different effects of COVID-19 on emerging life expectancy:
- Different socioeconomic groups have been shown to be experiencing different changes in life expectancy. Higher socioeconomic groups have far outpaced lower socioeconomic groups in life expectancy increases.
- The CDC and Social Security Administration data used in calibrating the mortality projection scale is referred to as “population-level” data. While appropriate for projecting an entire population’s mortality improvement (like the US as a whole), it starts to break down when applied to sub-populations:
- Pension plan participants overall tend to be more affluent than the general population and are likely to be experiencing different levels of improvement.
- Geographically-concentrated areas are likely to experience (and have already experienced) different improvements to those seen on average across the country.
- Pension plans with heavier concentrations in certain industries and job types should expect different future improvements.
- Pension plans that have undertaken pension risk transfer exercises (lump sum windows or annuity purchases, each of which tend to remove lower benefiting participants) will often be left with participants with a higher socioeconomic status, who are likely to be experiencing different levels of improvement.
It may be appropriate for the pension industry to develop a mortality projection scale that is driven by pension plan participants, stratified by socioeconomic status and if possible, based on more up-to-date information.
VitaMins: Society of Actuaries' MP-2020
Download the full article