


With the first month of 2021 well behind us and Statistics Canada releasing updated data last week regarding Canadian deaths during 2020, we wanted to provide an update on the impact the pandemic has had on Canadian mortality.
Tighter restrictions to bend the curve
In early 2021, average daily new cases during the second wave had quadrupled the highs seen in the first wave, leading to very serious concerns about the spread of the virus in Canada. In addition, by the end of January more deaths had been attributed to COVID-19 during the second wave than in the first. To combat the escalating case and death counts, some provincial governments implemented even tighter restrictions aimed at reversing the upward trend, and designed to mitigate the imminent threats to hospital systems and the most vulnerable Canadians.
Chart 1 below shows the progression of the average daily number of new cases (purple line) and deaths (green line) in Canada up to February 16, 2021. Unfortunately, early January saw cases spike further upward after briefly plateauing in December, with average daily deaths climbing close to the highs reached during the first wave. While the level of new cases and deaths are still concerning, it is very good to see the significant declines over the latter half of January and into February.


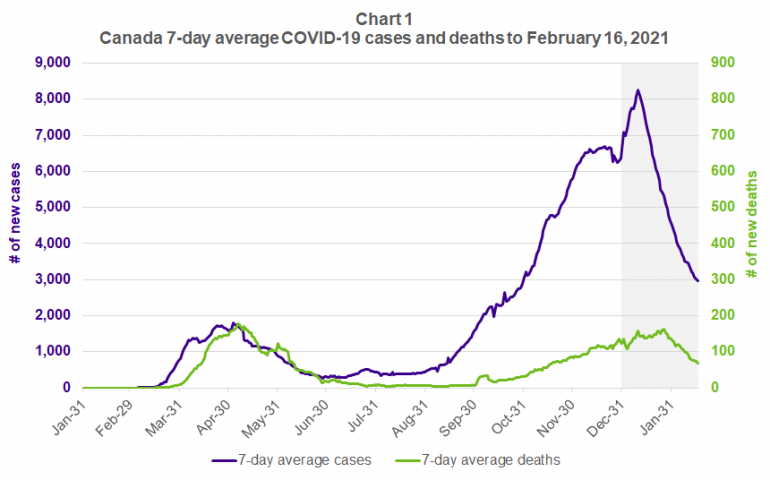
Data source: Government of Canada, Coronavirus disease 2019 (COVID-19): Epidemiology update.
Chart 1 also highlights that the relative level of COVID-19 deaths versus cases during the second wave remains significantly lower than the first wave, which can be attributed to positive factors such as:
- a lower proportion of positive cases in the elderly;
- additional safety measures implemented in long-term care homes;
- advancements in treatment and prevention; and
- higher testing levels.
Given the recent decline of daily cases and deaths, we wanted to look at how the latest heightened provincial public health restrictions may have contributed to bending the curve. In Canada, each provincial government has taken its own approach to managing the virus, and in most cases the strategies are dynamic and periodically evolve. In Chart 2 we’ve focused on the impact of the implementation of the most recent heightened restrictions in Canada’s four largest provinces, generally followed by in a significant decline in daily reported case levels.
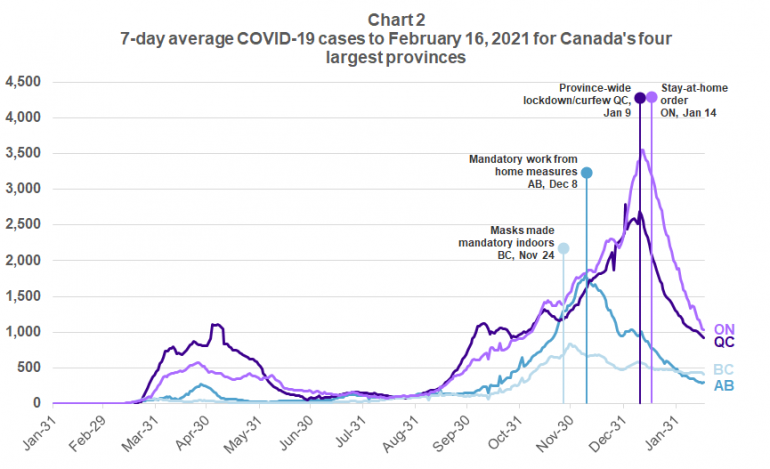
Data sources: Government of Canada, Coronavirus disease 2019 (COVID-19): Epidemiology update.
McCarthy Tétrault, COVID-19: Emergency Measures Tracker.
Some provinces have already started easing their tighter restrictions, despite average daily new case levels still being well above, or close to, the highs reached during the first wave of the pandemic. It is unclear how long the provincial governments will keep the remaining tighter restrictions in place, ease restrictions further or whether there will be a need to reimplement heightened restrictions.
2020 weekly deaths were higher than the expected levels, but by how much?
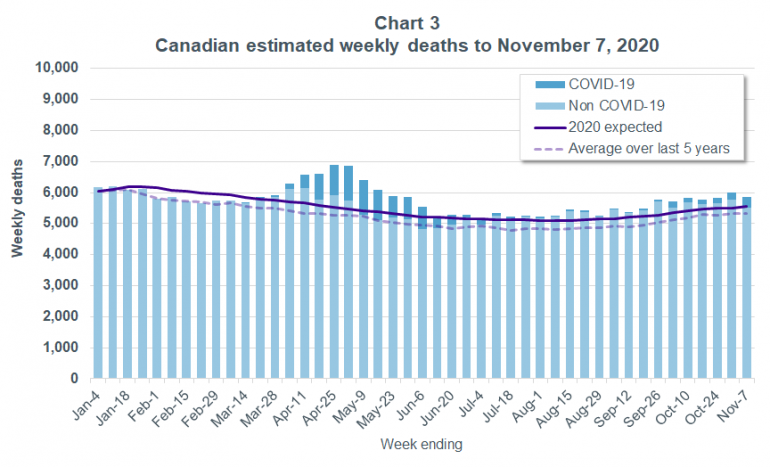
Chart 3 shows 2020 total weekly deaths for all of Canada based on updated data released by Statistics Canada last week. The bars represent the number of total deaths in Canada by week, with the dark blue portion representing the number of reported COVID-19 deaths. Our previous articles have focused on how 2020 total weekly deaths compare to the average over the five preceding years (shown by the light purple dashed line). However, we’ve now also compared to Statistics Canada’s expected number of deaths based on their extrapolation of weekly death data for the period 2015 to 2019. The following points summarize key observations regarding Canadian 2020 weekly deaths compared to the expected and average levels:
- Expected weekly deaths are higher than the average over the preceding five years, with the cumulative expected deaths over the period shown exceeding the cumulative average deaths by about 5%.
- Weekly deaths were below Statistics Canada’s expectations until early March, were then above expected through April and May (with the increase appearing to be largely attributable to COVID-19 deaths), and weekly deaths were around Statistics Canada’s expectation from June to August before moving somewhat higher than expected in September.
- Over the period shown, the total actual deaths were 4.9% higher than expected, which is significantly lower than the increase in deaths based on the average over 2015 to 2019 (which is 9.9%).
Data sources: Government of Canada, Coronavirus disease 2019 (COVID-19): Epidemiology update.
Statistics Canada, Table 13-10-0768-01 Weekly death counts, by age group and sex (2015 to 2019).
Statistics Canada, Table 13-10-0784-01 Adjusted number of deaths, expected number of deaths and estimates of excess mortality, by week (2020).
Chart 4 shows the ratio of 2020 cumulative weekly deaths to Statistics Canada’s expected deaths for each province to October 31 (latest week with data available for Ontario). Contrasting Chart 4 with the corresponding chart shown in our previous article (based on average deaths over 2015 to 2019) highlights that the increase in deaths based on expected levels is less than that based on average levels for all provinces. These differences aren’t surprising given deaths are generally expected to increase as the Canadian population matures (even if longevity is improving). The difference between the two ratios is quite significant for some provinces – for example, Ontario’s increase in 2020 deaths (to October 31) based on the average is 111%, versus 104% based on expected deaths shown in Chart 4. The variations in the differences between the two ratios by province may be due to the different rates at which populations are maturing but also may be due to the approximate nature of Statistics Canada’s expectations (particularly for the smaller provinces).
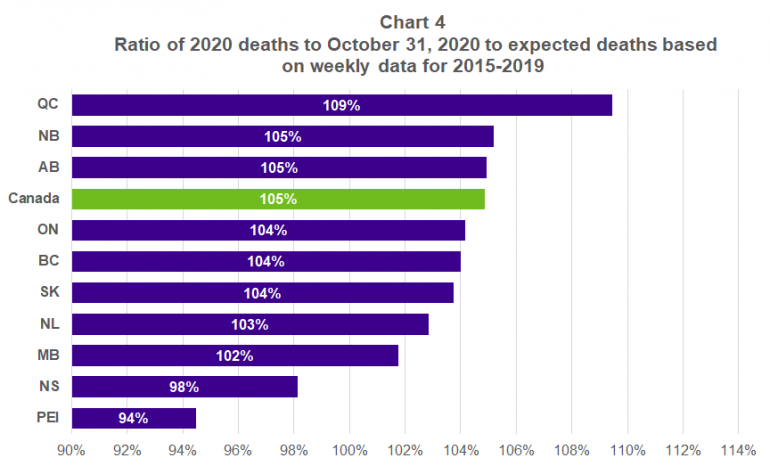
Data sources: Institut de la statistique du Québec, Weekly number of deaths in Québec, 2010-2021 (Québec actual).
Statistics Canada, Table 13-10-0784-01 Adjusted number of deaths, expected number of deaths and estimates of excess mortality, by week.
Notes: New Brunswick result in the chart only based on data until October 3, 2020.
We will have to wait for the release of more detailed 2020 data (i.e., by age) covering the entire year to determine more accurately the degree to which deaths have been higher (or lower) than expected for each province during 2020. We can, however, safely say that based on the preliminary estimate of an increase of 5% over expected 2020 Canadian deaths, the impact of COVID-19 on mortality in Canada is significantly lower than what has been experienced by the UK (Club Vita UK has estimated 2020 UK deaths to be 13.5% higher than expectations). Whereas the impact in Québec appears to have only been moderately lower than that of the UK.