


The recently released CPM2024 baseline mortality tables are a step forward in capturing longevity risk variation across Canadian pension plans. The previous set of tables, CPM2014, was split by public and private sector. However, the recent research has abandoned this segmentation after identifying significant heterogeneity within both sectors (a finding that aligns with Club Vita’s research).
Instead, the new tables distinguish between retirees (first lives) and surviving spouses (second lives), which is a welcome enhancement. They also introduce Heavy, Light, and Combined table categories with the goal of providing practitioners with additional flexibility for capturing the longevity characteristics of different pension plans.
However, by design, CPM2024 is intended to function as an industry‑wide benchmark. As a result, its construction follows a largely “top‑down” approach, smoothing out heterogeneity in the underlying data. This in contrast to Club Vita’s “bottom‑up” approach, which models longevity at the individual level and then aggregates those characteristics to create tailored factor‑based mortality tables.
While we believe CPM2024 is an improvement over CPM2014, it is important to note that, as an industry-wide benchmark, it will not capture the full range of variation observed within pension plans. In practice, many plans diverge materially from industry averages due to differences in socioeconomic profile, occupational mix, and geographical concentration. As a result, actuaries will need to consider how assumptions should be tailored to better reflect these plan‑specific longevity characteristics.
In this article, we explore the key drivers of longevity differences observed within Canadian pension plans. We also analyze why some pension plans may face challenges when implementing CPM2024 directly, and why additional analysis or a different methodology may be required to better reflect a pension plan’s specific longevity profile.

Canadian pension plan longevity is diverse
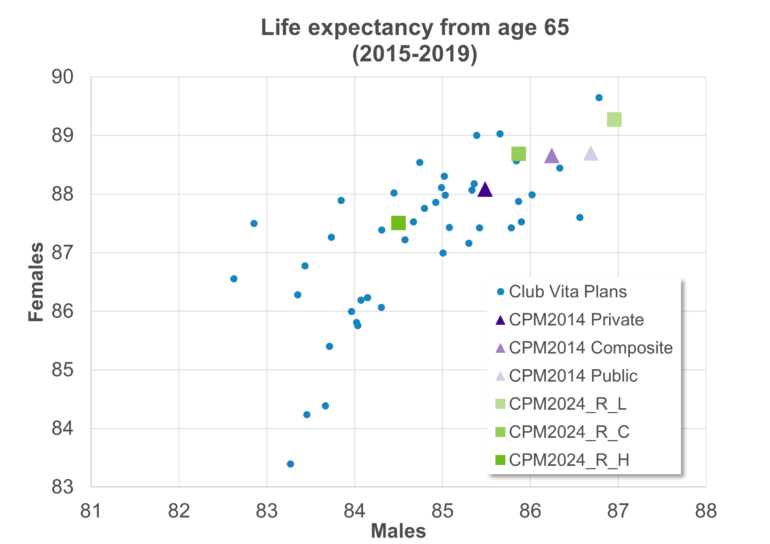
The scatterplot below illustrates life expectancy at age 65 for male and female pensioners for a sample of pension plans in Club Vita’s Canadian dataset (blue dots), alongside life expectancy at age 65 derived from the six CPM2024 retiree tables (green squares) and the six CPM2014 retiree tables (purple triangles). First, we see that CPM2024 reflects a wider range than CPM2014. Specifically, the difference in life expectancy at age 65 between the lowest‑mortality and highest‑mortality CPM2024 tables is 2.7 years for males and 2.6 years for females, compared to 2.2 years for males and 1.3 years for females under CPM2014. However, the chart shows a much greater dispersion in life expectancy among the pension plans analyzed than is captured by the CPM tables. And very few of the plans represented by the blue dots would have their specific mortality closely matched by one of the available CPM base tables.
Notes:
1. Chart shows period crude life expectancy, with smaller plans excluded due to low credibility.
2. Each blue dot shows the average life expectancy of pensioners of a pension plan in Club Vita’s Canadian longevity data set.
3. CPM2014 and CPM2024 tables were adjusted from their effective dates to 2017 using CPM-B improvement scales.
What are the drivers of longevity amongst pension plans?
Club Vita’s research shows that a significant amount of this longevity diversity can be explained using pensioner data that is currently available to plan sponsors and actuaries. The table below shows longevity predictors incorporated in Club Vita’s baseline model and the data indicator used for each.
Longevity Predictor | Indicator Used by Club Vita | Used in CPM2024 |
Gender | Male / Female | ✔ |
Pensioner type | Pensioner / Surviving beneficiary | ✔ |
Lifestyle | Postal code | X |
Affluence | Salary and pension amount | X |
Retirement health | Disabled vs. normal retirement | X |
Occupation | Blue‑collar (manual) / White‑collar (non-manual) | Proxied by Heavy/Light/Combined categories |
Marital status | Pension form (Joint‑life / Single‑life) | X |
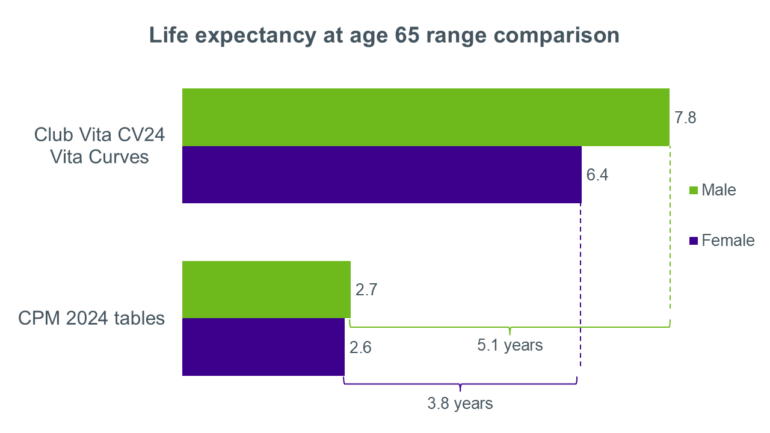
When these variables are modelled simultaneously using a factor-based mortality model such as Club Vita’s VitaCurves, the resulting spread in longevity is far wider than that implied by traditional industry tables. In Club Vita’s latest Canadian model, the difference in life expectancy at age 65 between the lowest‑mortality and highest‑mortality tables is 7.8 years for males and 6.4 years for females.
When “Heavy” Isn’t Heavy and “Light” Isn’t Light?
The CPM2024 tables include variations for Heavy and Light mortality. These categories were constructed by comparing each plan’s observed mortality experience in the underlying dataset to the CPM2024 aggregate table. Then, plans whose experience was consistently heavier or lighter than the aggregate table were grouped together to form the Heavy and Light table categories. The aggregate table based on the full dataset is the “Combined” table.
It is important to note that this segmentation is not based on modelling the underlying risk drivers discussed earlier, but by filtering on the resulting mortality experience. As a result, the Heavy and Light tables capture plan’s historical experience relative to the Combined table, but not why they differed from the Combined table. Practitioners wanting to use the Heavy and Light tables will still need to make judgements about which tables are most appropriate for specific plans.
The research states that
“a plan covering “blue-collar” unionized and/or hourly employees, particularly in occupations involving heavy manual labour, can be expected to generally have mortality patterns more aligned with the Heavy table. Conversely, plans covering “white-collar” workers such as professionals, management, and many in the education area can be expected to see mortality patterns that more closely resemble the Light tables.”
However, not all blue-collar or heavy industry plans will be best represented by the Heavy tables, and not all white-collar or light industry plans will be best represented by the Light tables.
To understand how plans can diverge from these predicted categories, we analyzed the observed experience of a sample of plans in Club Vita’s data set to that expected under the CPM2024 Combined table over the period 2015-2019. We completed this analysis using two classifications:
- Occupational or collar mix: plans dominated by manual (blue collar) occupations, plans dominated by non manual (white collar) occupations, and plans with a mixed or unknown occupation profile.
- Industry: industries typically associated with heavier mortality (such as manufacturing, mining, and construction), lighter mortality industries (such as finance and education), and those that tend to be more mixed (such as healthcare).
The charts below show the results of this analysis which broadly aligns with expectations. The chart shows a ratio of the actual mortality experienced by the different plans by the mortality expected under the CPM2024 Combined table. An actual-to-expected (“A/E”) ratio above 100% indicates heavier mortality (more deaths) than expected and a ratio below 100% indicates lighter mortality (fewer deaths) than expected.
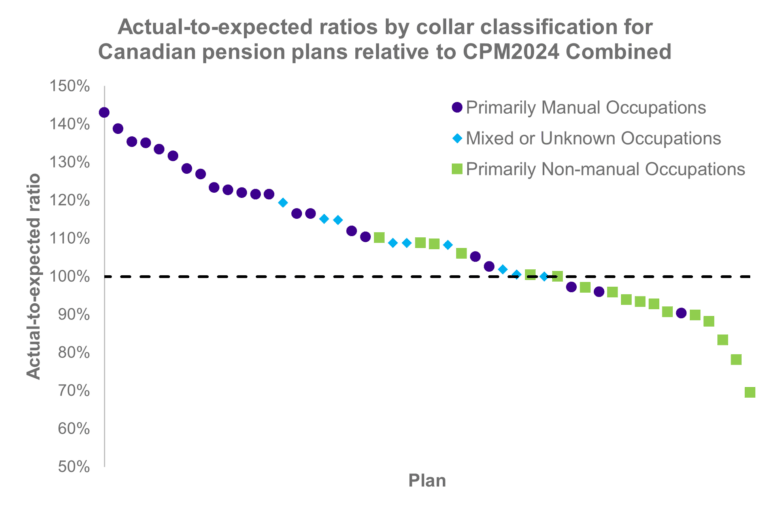
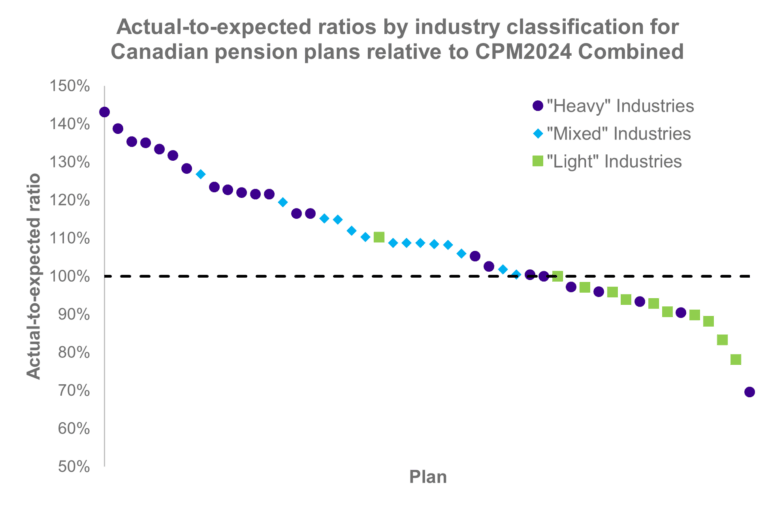
Whereas plans with predominantly manual workforces or operating in traditionally “heavy” industries tend to exhibit heavier mortality experience and plans dominated by non manual occupations or “light” mortality industries tend to exhibit lighter mortality, the results are far from uniform and we observe some notable exceptions. A number of plans from “heavy” mortality industries / manual occupations exhibited very light mortality; some plans from “mixed” mortality industries / occupations exhibited very light mortality; and some plans from “light” industries / non-manual occupations exhibited more average mortality.
Another important takeaway from this analysis is the magnitude of the divergence observed for many plans. In several cases, A/E ratios sit well above or well below the Combined table because traditional tables can often lead to blunt assumptions. As a result, large adjustment factors would be required if performing a credibility adjustment. This is not ideal as large adjustments can introduce additional measurement risk, particularly when applied uniformly across all ages. In practice, if a plan’s experience is materially lighter or heavier than expected by the underlying table, the critical question is not how large an adjustment is required, but why the difference exists.
Ultimately, pension practitioners will need to think carefully about how well mortality assumptions reflect the plans they are advising - whether by conducting additional analysis and applying appropriate judgement or by adopting factor‑based approaches that explicitly capture the drivers of longevity differences.
Tailoring longevity assumptions
Completing an experience study will be a good starting point for many plans looking to tailor their assumptions to their specific mortality characteristics. This may involve analyzing the pension plan’s recent mortality experience against the three table categories to see which provides the closest overall fit, and whether an adjustment factor is required.
Experience studies are a useful tool but how they are interpreted is even more important than the results themselves. The following are some considerations for experience results.
Large adjustment factors
When the experience study suggests large deviations from all three CPM2024 tables, forcing a fit through large adjustment factors is not ideal. Large adjustment factors can increase measurement risk and often require complex age-specific adjustments. At that point, the experience study is doing something more valuable than identifying a “best fit” table, it is signalling that the underlying table may not be well aligned with the plan’s true longevity characteristics.
Interpreting COVID years of experience
Experience in COVID years can distort results, as the excess mortality may not reflect the plan’s underlying longevity profile, especially for plans with a strong geographical concentration. In many cases, this means placing greater emphasis on pre pandemic data, reviewing experience over a longer time horizon, or making adjustments for excess mortality during the COVID period.
Small plans
For smaller plans, experience studies can be more difficult. There is likely limited data which can result in volatile experience results. The risk here is that relying too heavily on the plan’s experience could introduce instability into assumptions, while defaulting to a single industry table risks masking persistent plan level differences.
A better alternative: Factor-based models
All of the analysis so far points to the same conclusion: to set better longevity assumptions, you need to understand the underlying drivers of mortality differences. This is where factor‑based models become incredibly powerful.
Rather than starting with an aggregate industry table and making adjustments, factor‑based models begin with the characteristics of the pension plan. They explicitly model the attributes shown to influence longevity and use those features to build expected mortality from the bottom up. In doing so, the focus shifts away from determining which table fits best to a more meaningful question: does this assumption reflect the actual longevity characteristics of the plan’s members?
To illustrate this difference in approach, we extended our A/E mortality analysis and compared the results for Club Vita’s data set of pension plans across four models:
- CPM2014 Composite tables
- CPM2024 Combined table
- CPM2024 with tables selected based on occupational mix: using the Heavy table for predominantly manual plans, the Light table for predominantly non‑manual plans, and the Combined table for mixed plans
- Club Vita’s latest Canadian factor‑based model, VitaCurves
For each model, we plotted the A/E ratios ratio sorted by plan size (the largest plans are on the right, the smallest on the left). The green lines show a 95% confidence interval for the A/E values (the confidence interval is wider for smaller plans). Conceptually, the more plans that fall within these bands, and the more tightly clustered they are around 100%, the better the model explains observed mortality experience.
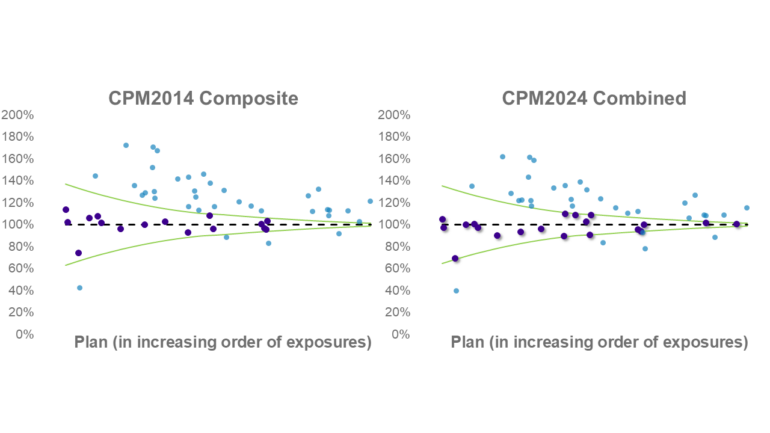
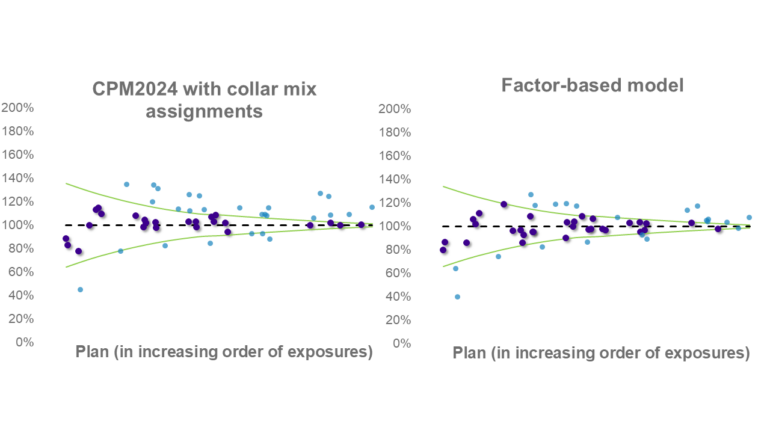
Moving from CPM2014 to CPM2024 results in 6% more plans falling withing the confidence range, and further refinement using occupational mix assignments does even better with an additional 10% falling within the confidence range. The VitaCurves factor-based model provides by far the best overall fit with the highest number of plans falling within the confidence intervals as well as lower systematic bias away from the 100% line.
What actuaries should be considering?
The range of longevity outcomes across pension plans is much wider than industry tables suggest
Club Vita’s modelling explains a spread in life expectancy at age 65 of 7.8 years for males and 6.4 years for females whereas CPM2024 captures just under 3 years. As many pension plans will not sit close to the “average” experience implied by the CPM2024 tables, actuaries should consider whether alternative approaches are needed to develop mortality assumptions that better reflect plan‑specific longevity characteristics.
Experience studies are valuable, but not the be‑all and end‑all
Many plans will naturally begin by completing an experience study to assess alignment with CPM2024. While this can provide useful insight, practitioners should be mindful of the limitations, including the use of large adjustment factors, the implication of COVID years of experience, and credibility, particularly for smaller plans.
Modelling the underlying longevity drivers will improve the performance
Our analysis shows that moving from CPM2014 to CPM2024 improves fit to plan experience and selecting a table by occupation profile improves it further. However, this approach ignores many of the underlying drivers of longevity. A factor‑based model can provide greater predictive power by modelling various longevity drivers simultaneously and allow for more stable and defensible mortality assumptions.
If you would like support interpreting your plan’s mortality experience, understanding what is driving your longevity profile, or assessing whether a multi‑factor framework such as VitaCurves may be appropriate for your plan, we would be pleased to discuss how we can help.
What do you think?
Lastly, we’d love to hear from you. Please contact us with any questions or topics you want us to cover.
Need more information?
If you have any further questions our team would be happy to help you.