


Question:
Have mortality improvement rates among Canadian Defined Benefit (DB) pensioners differed across socio-economic groups between 2005 – 2019?
Answer:
Yes. Disparities in improvement rates exist among both male and female pensioners. Club Vita’s own research [Club Vita | Canada | Canadian Mortality Improvements] shows that DB pensioners belonging to the lowest socio-economic groups experienced slower improvement rates than the Canadian population while improvement rates among the highest socio-economic group were noticeably higher than the general population.
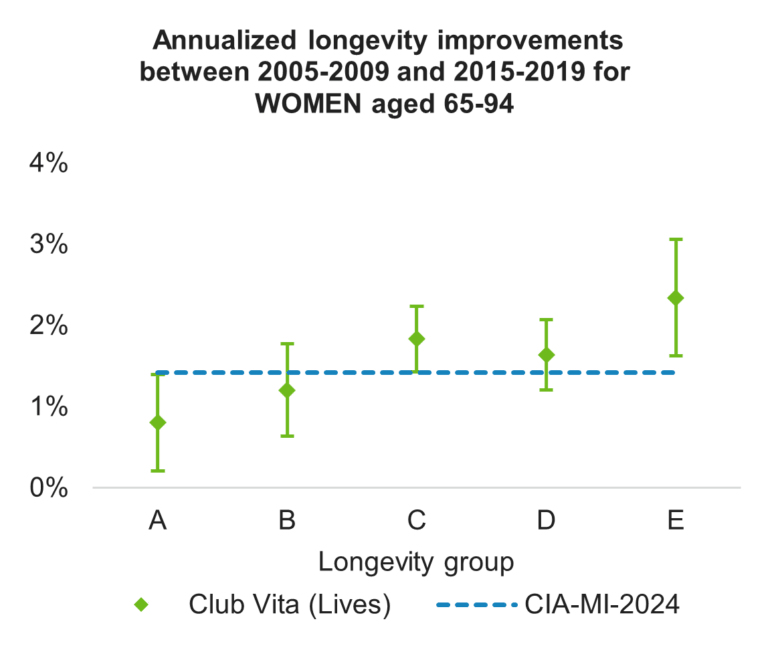
Club Vita uses socio-economic and lifestyle related information encoded in postal codes to group male and female Canadian pensioners into one of five different longevity groups (A being the shortest lived and E being the longest lived). The charts below show the annualized improvement rates, including 95% confidence intervals, for these different groups over the period (2005-2009) to (2015-2019). There is a distinct gradient in improvements across the socio-economic spectrum, with the longer living groups also seeing the highest improvements over the period.


Key takeaways
- Over the period studied, there is a distinct gradient in improvements across the socio-economic spectrum, with the longer living groups also seeing the highest improvements.
- The shorter living longevity groups A and B experienced lower improvement rates compared to the general population average rates in the CIA-MI-2024 improvement scale.
- We observe a similar gradient among male and female pensioners. We note that the largest gender-based difference is found within Longevity group A.
- Pensioners in the longer living longevity group E experienced the fastest rate of improvement, well above the population average, and approximately double the rate observed in longevity group A.
The key questions are:
- How will long-term improvement rates evolve among pensioners? Will the socio-economic gap continue to grow or will improvement rates converge? Will the transition be similar among males and females?
- Will the long-term impact of COVID-19 on pensioner mortality be the same across all longevity/socio-economic groups?
- How should insurers and plan sponsors account for socio-economic disparities when modelling pension liabilities using an industry table?