


On December 4th, 2024, Statistics Canada (StatsCan) released their updated complete (and abridged) life tables which include data up to the end of 2023i The Canadian media covered the release. CTV News, for example, summarized the new Statistics Canada data with the following headline: “Canadian life expectancy up, but still below 2012 levels”. Such a headline may give readers the wrong impression about underlying mortality trends in Canada.

Question: Did Canada really experience a lost decade of mortality improvements?
Answer: The answer depends on the age of the population with which you are concerned; assessing the impact on pension plans and insurers requires some nuanced analysis.
The recent media analysis of mortality data was focused on period life expectancy from birthii. This metric can be a good measure for the general health of a nation as it incorporates mortality rates across the full age spectrum. However, pension plans and insurers will be most affected by the life expectancy of people who have already lived past their younger ages, such as life expectancy from age 40 or age 65. These are conditional expectations: they represent the expected number of years until death given that someone has already survived to a certain age.
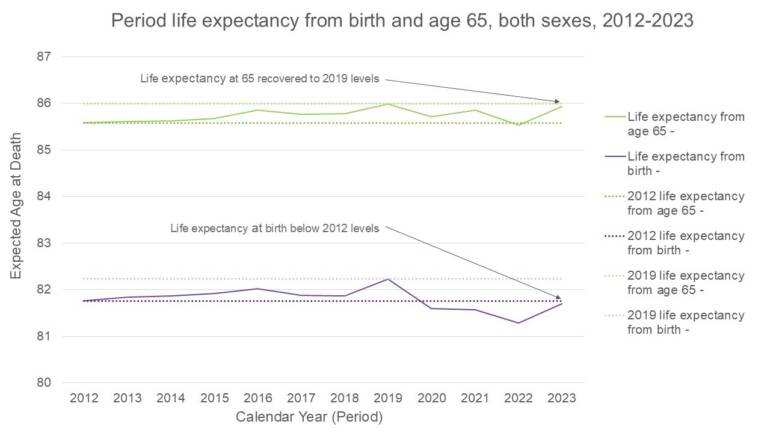
The chart below compares life expectancy from birth and from age 65 and how they have both progressed from 2012 to 2023:
Key Takeaways:
- Life expectancy from birth and life expectancy from age 65 follow similar trajectories prior to the pandemic. Both rise between 2015-16 & 2018-2019 after a decline between 2016-2018.
- During COVID-19, however, life expectancy from birth declines more sharply prior to rebounding in 2023. The biggest difference occurs in 2020-2021 where life expectancy from age 65 increases while life expectancy from birth does not.
- Overall, life expectancy from age 65 recovers to its 2019 value by the end of 2023 (well above 2012 levels) while life expectancy from birth remains well below 2019 levels and slightly below its 2012 value.
These charts demonstrate the importance of looking beyond the headlines and exploring mortality trends in greater detail. While it is correct to claim that life expectancy from birth is below 2012 levels, the same is not true for all ages.
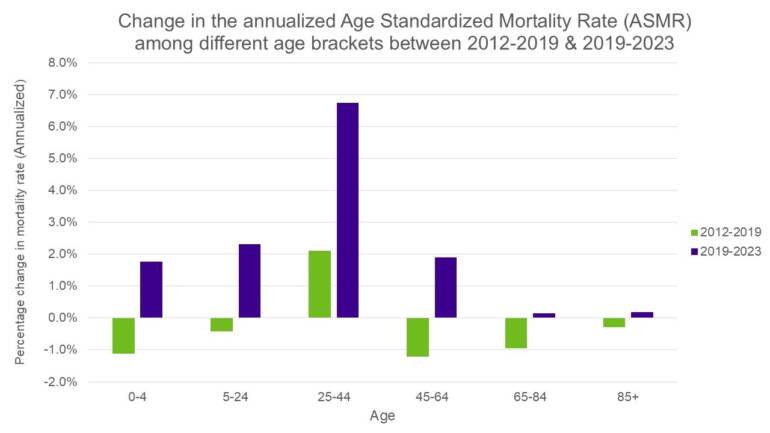
To shed some more light on the divergent trends observed above, the chart below shows the changes in mortality rates for different age groups. The green bars show the pre-pandemic 2012-2019 period and purple bars show the pandemic 2019-2023 period.
Source: Statistics Canada. Table 13-10-0837-01 Life expectancy and other elements of the complete life table, single-year estimates, Canada, all provinces except Prince Edward Island; Rates standardized using the following: Statistics Canada. Table 17-10-0005-01 Population estimates on July 1, by age and gender.
Key Takeaways:
- There is a distinct difference in trends in mortality rates for working-age people and retirees in Canada over the last decade.
- Before the pandemic, we saw consistent mortality improvements in the over 65s. Despite increases in mortality during the pandemic, mortality rates for this age group have nearly recovered to pre-pandemic mortality levels.
- However, the 25-44 age group was experiencing increases in mortality rates even before the pandemic. This effect has been amplified through the pandemic period, with mortality rates for this age group increasing significantly.
The key questions are:
- What is causing this increase in mortality for working-age people? And how will it develop into the future?
- Are we seeing the emergence of a new age effect of mortality changes – i.e., something that affects the mortality rates at particular ages in future years?
- Or could we be seeing the emergence of a new cohort effect – i.e., something that affects the mortality rates of a distinct group of people as they age?
What do you think?
Pension plans and insurers will want to monitor these emerging trends closely. If we are seeing the emergence of a cohort effect, this could soon start affecting the mortality rates of the retiree population as well as the working-age population.
Join the discussion on LinkedIn and let us know
[i] The release includes multiple tables including an abridged life table and three-year estimate tables in addition to the single year estimate tables. Club Vita chose to focus on the complete, single year estimate life table for this article. The tables were constructed using data from Statistics Canada Vital Statistics and the Demographic Estimates Program.
[ii] We note also that the StatsCan life expectancy figures we are referring to here are known as period life expectancies. These are calculations based on one year of data. They provide a snapshot in time for mortality. However, as they make no allowance for future improvements in mortality rates (like cohort life expectancies), they are not necessarily the most predictive measure of how long someone alive today will live.