


The Continuous Mortality Investigation (CMI) have proposed some significant changes to the upcoming CMI_2024 model. In the first of a short series of blogs, we discuss one of these changes: a new “Fitted Overlay” mechanism to directly allow for the pandemic

Back in 2021, a new feature was added to the CMI Mortality Projections Model: the W parameter. This was introduced so that the model could continue to produce plausible projected mortality rates in the wake of the first wave of the pandemic. Users of the model could set the weight placed on each year of England & Wales mortality data feeding into the projection. In the core version of CMI_2020, W2020 was set to zero. Similarly, in CMI_2021 and subsequent editions, both W2020 and W2021 were set to zero. This meant that the elevated mortality rates seen in 2020 and 2021 were entirely excluded from the projection.
Subsequently, CMI_2022 set W2022 to 25%, and then, somewhat unintuitively, CMI_2023 set both W2022 and W2023 to 15%. As we hit the fifth anniversary of the start of the pandemic, it has become increasingly clear that a different approach is needed to place the model on a sustainable footing. The CMI Mortality Projections Committee have therefore carried out a substantial review of the model. As part of that review they have proposed a different approach to COVID: the Fitted Overlay.
How does the Fitted Overlay work?
Unlike other recent editions, in the proposed CMI_2024 model, 100% weight is placed on each year of data, including 2020 and 2021. However, it is now explicitly assumed that mortality rates in each year since 2020 include an element of excess mortality – mortality above the level that might have been expected in normal circumstances (i.e., had there not been a pandemic). The Fitted Overlay is an estimate of the level of excess mortality suffered by the population in each year. By explicitly incorporating excess mortality in its assessment of emerging mortality improvements, the model can thereby also estimate the underlying trend that would be projected had the excess mortality not occurred.
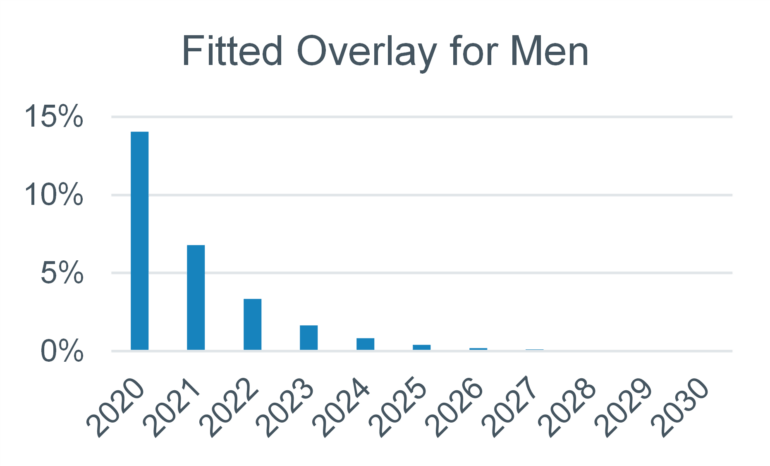
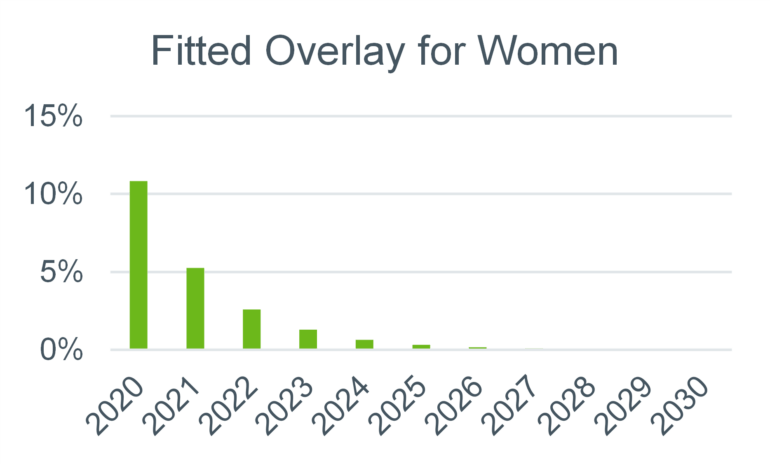
The Fitted Overlay in the proposed core CMI_2024 model is different for men and women but has the same value at all ages. The following pair of charts show the Fitted Overlay (expressed as a multiplier to mortality rates) for each year between 2020 and 2030 under the proposed core model.
Under the proposed core version of the model, the Fitted Overlay is assumed to halve each year. This means that COVID-related excess mortality is assumed to reduce to close to zero by 2027. Users can however alter the shape of the Fitted Overlay to reflect their own views of the ongoing impact of the pandemic
Why is this a better approach?
At Club Vita, we like the new approach of explicitly allowing for the impact of the pandemic in the model. Directly modelling excess mortality means that each year of data can be fully allowed for, rather than having to decide whether to exclude, partially include or fully include any particular year. Whilst the choice of the exact shape of the Fitted Overlay is somewhat subjective, the way the model interprets pandemic era data is very transparent to users. This contrasts with the two previous versions of the model which relied upon difficult to interpret intermediate values for the W parameter for 2022 and 2023.
If you take the view that the excess mortality allowed for is a sensible interpretation of the data, the new approach produces what looks like an entirely plausible projection. We illustrate this by showing projected mortality rates under the proposed CMI_2024 model. We then compare this projection with an alternative approach which places 0% weight on 2020 and 2021 data, and 100% weight on all other years1.
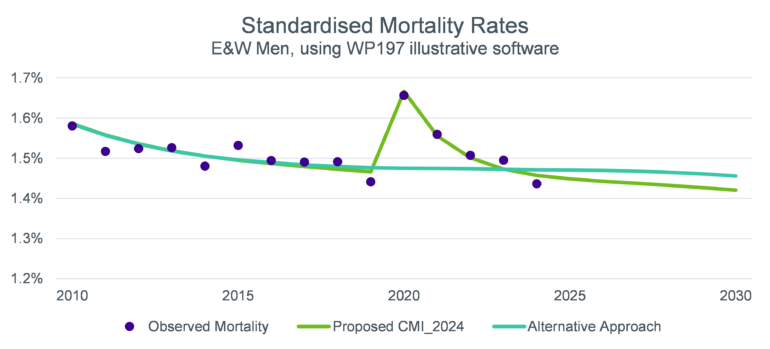
1 The Alternative Approach illustrated here (described as “Option B” in CMI WP197) was also strongly considered by the Projections Committee.
Under the Alternative Approach, 100% weight is placed on 2022 and 2023 data, but without any allowance for excess mortality having occurred in those years. This leads to a very low level of improvements being assumed in the post pandemic period because the 2022 and 2023 data points are assumed to be fully indicative of the underlying trend. In our view, this projection looks very pessimistic in the context of 2024 mortality rates.
The new approach should put the model on a sustainable footing. Each additional year of data from 2025 onwards will be assumed to include very little excess mortality. Over time, the model will naturally blend into the emerging post-COVID trend. The exact shape of the Fitted Overlay will therefore become less influential on the projection over time.
What does this mean for users of VitaCurves?
In each year since 2022, Club Vita has published two versions of the VitaCurves model:
- a “business as usual” version which includes the excess mortality associated with COVID (“v1”)
- a “COVID Adjusted” version, which strips out an estimate of the excess mortality associated with COVID (“v2”)
There are clear parallels between our Covid Adjusted curves and the proposed new approach. However, as things stand, the two models will not integrate naturally. This is because our v2 curves have excess mortality stripped out whereas the CMI model’s projection will include the Fitted Overlay.
There is a straightforward solution to this problem: to use v2 VitaCurves in combination with the “Underlying Trend” projection which forms a natural component of the new CMI model approach. We show an example of this Underlying Trend projection below.
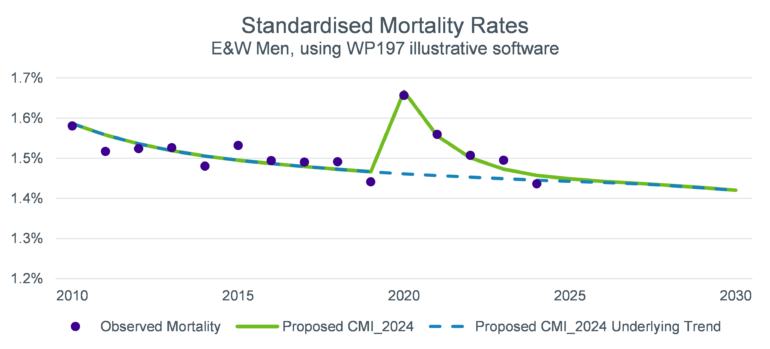
We have asked the CMI Projections Committee to make this Underlying Trend projection easily available to users of the model as either a core or extended parameterisation. This will ensure that users of v2 VitaCurves can continue to use those curves in combination with an off-the-shelf version of the CMI_2024 model.
What happens next?
The Projections Committee have carried out a consultation on the proposed model, which has now closed. You can read Club Vita’s response to the consultation here.
We are expecting the committee to provide an update on next steps following the consultation during mid-April. The final version of CMI_2024 is expected in the second quarter of 2025.
What do you think?
We’d love to hear your thoughts on the Fitted Overlay or any other comments or questions you have on the proposed CMI_2024 model.