


In this regular column, Club Vita’s longevity experts will help you visualise the often abstract world of longevity risk by introducing some of their favourite charts.
21 January 2019
In this edition, Oreofe Majekodunmi takes a closer look at how affluence affects the likelihood of being married.
Question:
Does wealth affect how likely someone is to be married?
Answer:
Yes, however the direction of the effect depends on whether we are looking at men or women.
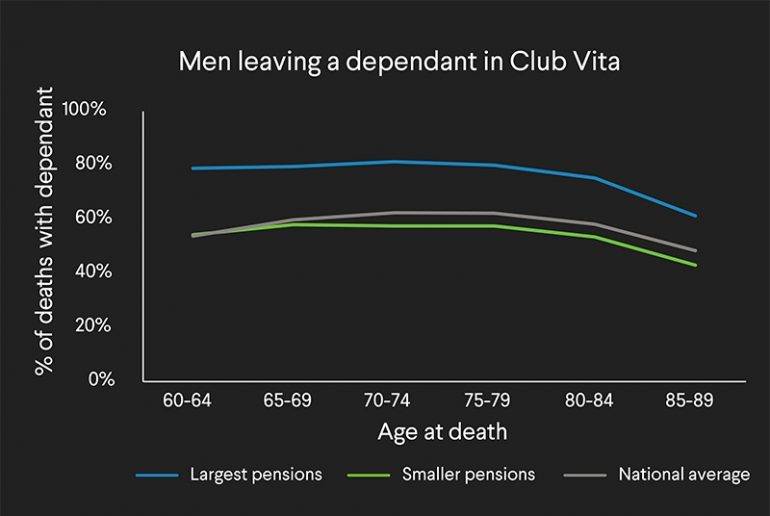
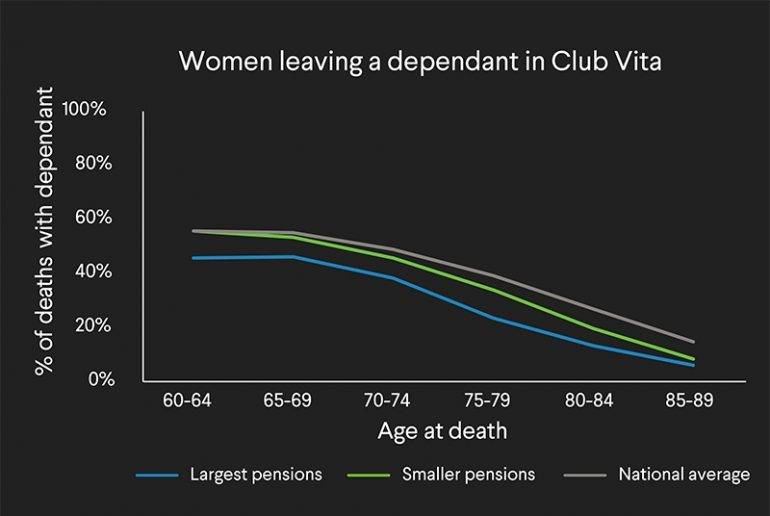
The charts below show the proportion of people at different ages who leave a surviving spouse when they die, highlighting men and women in the Club Vita data set with the highest and lowest pensions and the national average (note that the Club Vita data sets only covers people in receipt of defined benefit occupational pensions).
Men with higher pensions are more likely to be married when they die. Perhaps wealthier men are more likely to be married, or perhaps wealthier men are more likely to marry younger spouses (who are more likely to survive their husbands). Conversely, women with higher pensions are the least likely to be married when they die. Perhaps married women left the workforce to raise families, resulting in smaller pensions, or perhaps women with the largest pensions are more likely to outlive their spouses due to increased lifespans or having older spouses?
Source: ONS data on registered deaths in England & Wales, 2013. Club Vita data on male and female dependants linked to male and female pensioner deaths by age and pension band [2011-2015].
Chart for women updated on 24/05/2019.
Key takeaways
- Men with the highest pensions are most likely to be married when they die
- Women in the Club Vita data set are less likely to be married when they die than the national average, and women with the highest pensions are the least likely to be married when they die
The key questions for pension schemes and insurers are:
Are you allowing for these differences in your assumptions? How might these differences change with the increase in women in the workforce?
What do you think?
Please post your questions in our Friends of Club Vita discussion group on LinkedIn.
Top Charts 19-10: Marriage and affluence
Click the button below to download a PDF copy of this article.