


In this regular column, Club Vita’s longevity experts will help you visualise the often abstract world of longevity risk by introducing some of their favourite charts.


Question:
How might the relative light mortality experienced so far in 2019 affect the impact of the next CMI mortality projections model on pension fund liabilities?
Answer:
The mortality data for 2019 so far suggests that there will be at least some ‘bounce back’ to higher annuity values when updating the core CMI_2018 model for the upcoming core CMI_2019 model. Funds using the core model without adjustment will therefore be likely to see an increase in liabilities.
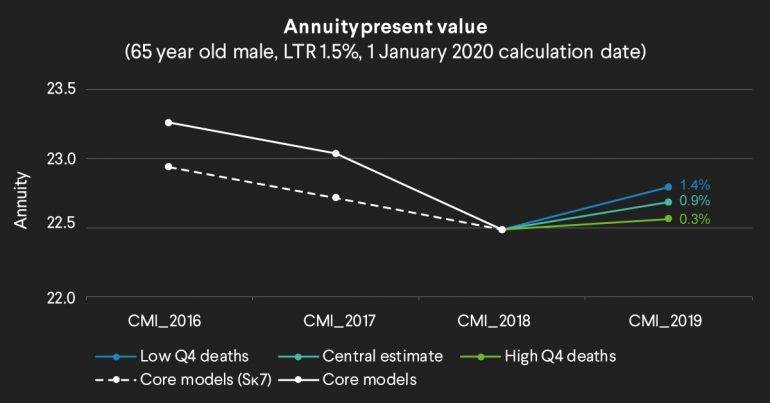
Note: The annuity values shown are for men at age 65, based on the S3PMA base table, with a net interest rate of 0% p.a. and assuming a long-term rate of 1.5% p.a. in each case. Calculations were carried out using the CMI_2018 model, and the E&W population data included with that model. CMI_2019 values are based on fitting the model to 1979 to 2019, where the level of deaths in 2019 have been estimated using improvements of 3.5%, 4.8% and 6.2%, and assuming exposures in 2019 are equal to those in 2018. The calculation date is set to 1 January 2020 throughout.
Key considerations
- So far, 2019 has seen fewer deaths compared to recent years (even despite the aging population).
- Even assuming a high level of deaths until the end of the year, we expect to see a bounce back to higher improvements in the 2019 version of the CMI projection model.
- All else equal, this will result in an increase in liabilities, with our central estimate seeing a rise of c1%.
The chart above shows how annuity values have changed under different updates of the core CMI projection model. We note that the core parameters of the model were updated in the CMI_2018 model and we have included figures for past versions of the model with the CMI_2018 model core settings for comparison.
The chart also shows a range of potential annuity values for the upcoming core CMI_2019 model, depending on how the last quarter of the year turns out. The ‘central’ estimate assumes improvements in mortality rates remain at the current level, the high and low scenarios assume the last quarter of 2019 is in line with the ‘best’ and ‘worst’ experience seen over 2009 to 2018.
The key questions are:
- Will the trend of lighter mortality continue to the end of the year?
- Is a bounce back in 2019 a temporary blip or a return to high levels of improvements?
- Will these effects be experienced differently by different sections of society?
What do you think?
Please post your questions in our Friends of Club Vita discussion group on LinkedIn.
Club Vita's Top Charts Issue 16: Looking ahead to the CMI’s 2019 mortality improvement projections model
Download a print friendly version of this article.