


In this regular column, Club Vita’s longevity experts will help you visualise the often abstract world of longevity risk by introducing their own personal favourite charts.
In this edition Club Vita's Head of Analytics, Conor O’Reilly shows how weekly deaths in England & Wales over 2017 compare to previous years.

Deaths in England & Wales over 2017
Question:
How does the number of deaths in England & Wales over 2017 compare to previous years?
Answer:
The answer is that deaths continue to be relatively high, compared to the previous decade. However, this doesn’t tell the whole story when thinking about longevity improvements.
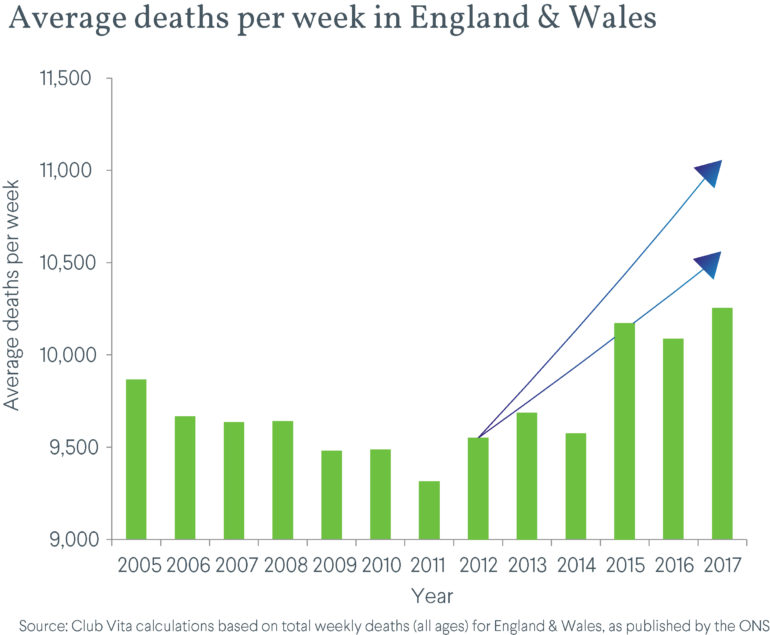
The chart below shows the annual average deaths per week back to 2005, based on the number of deaths registered in England & Wales, as published by the ONS.
The average deaths per week in 2017 was the highest over the whole period, higher even than 2015. However, the average age of people in England and Wales is increasing, and so the number of deaths would be expected to increase as a result. If life expectancy were to stay broadly the same, we would expect an annual increase in the number of deaths of around 2-3%. The blue lines on the chart show how we would expect the average deaths to increase from 2012, allowing only for the impact of population aging.
In summary, life expectancy is still increasing, but not as quickly as expected back in 2012.
Key takeaways from this chart
- Total weekly deaths in E&W have been noticeably higher over the last 3 years than in the previous decade
- The average deaths per week in 2017 was higher even than 2015
- However, due to the aging population, a 2-3% annual increase in average weekly deaths would be expected if life expectancy stayed broadly the same
- Life expectancy continues to improve, but at a slower rate than before
The real question though is:
What will happen in the future?
Are the higher levels of deaths seen in the last 3 years indicative of a new trend, or are they simply the result of volatility? Views on the answer to this question will influence the assumptions for future mortality improvements adopted by pension funds, as well as insurers.
What do you think? Please post your questions in our Friends of Club Vita discussion group on LinkedIn.