


In this new regular column, Club Vita's longevity experts will help you visualise the often abstract world of longevity risk by introducing their own personal favourite charts.
In this edition Longevity Risk Consultant, Nick Chadwick, shares a way of visually comparing the impact of the Sκ parameter on mortality projections.

What does The Sκ parameter actually mean?
Question:
As a species, actuaries love models and technical jargon. And sometimes we forget that not everyone loves models and technical jargon as much as we do. So when your actuary recommends that you use the CMI_2017 mortality improvements model with an Sκ period smoothing parameter of 8.0, a reasonable response might be “what the *#!% does that mean?”
In practice however the new Sκ smoothing parameter is a valuable additional and complementary “moving part” to the existing long term rate parameter. But what does it actually mean?
Answer:
In simple terms, the CMI model estimates the current rate of improvement in the England & Wales population and blends these over time to a long term rate.
When estimating current rates, users can decide how much smoothing to apply. In particular, the user can vary the level of year-on-year smoothing. This is where the Sκ parameter comes in. The core value for this parameter selected by the CMI is 7.5, but users can choose to increase or decrease this value. This choice comes in handy in the current climate, where recent trends have been particularly volatile and where the evidence is mixed.
In this month’s chart we look at the how the level of mortality improvements will emerge over time under different values for the Sκ parameter. We compare these to recent trends for two groups:
- Men in England & Wales
- The “Comfortable” socio-economic group of men as set out in Club Vita’s study with the PLSA. Due to high pension amounts, this group tend to make up a large proportion of liabilities for most DB schemes.
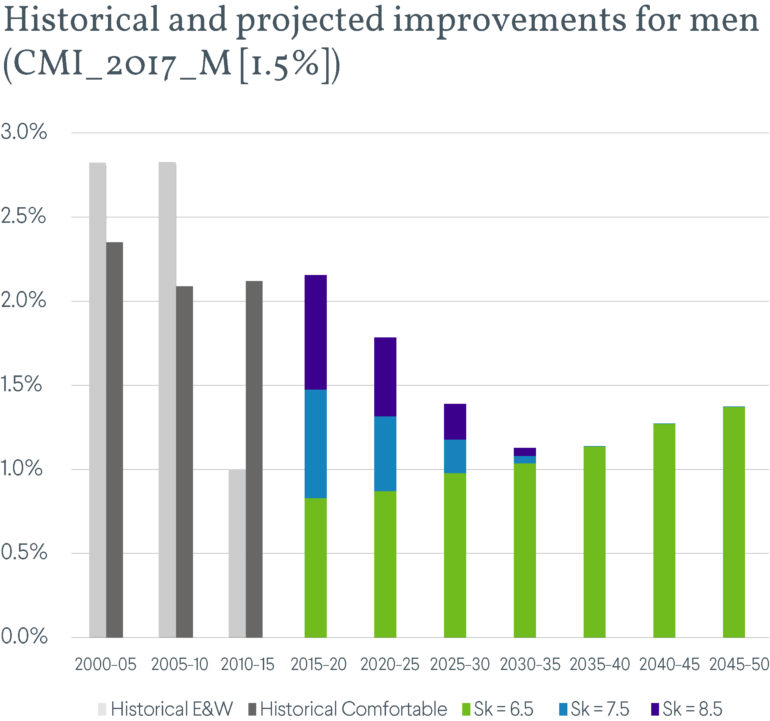
Technical note: Figures shown are based on Standardised Mortality Rates based on 65 to 95 year olds, with weightings based on 2010 exposures.
Key Takeaways
- Sκ only impacts improvements over 15 years or so, with the biggest impact in the short term.
- A higher value currently allows for more improvements, and vice versa.
- In contrast to the general population, comfortable men continued to see stable improvements during 2010-15.
- Users should consider all the evidence relevant to their scheme when selecting a value for Sκ. A higher value than 7.5 may be appropriate.
If you've any comments or questions we'd love to hear from you. Get in touch via our Friends of Club Vita discussion group on LinkedIn.