


Now six years on from the emergence of the SARS-CoV-2 virus that shook the world, emerging mortality statistics are starting to map out a new normal. Retiree populations are now beginning to see the re-emergence of mortality improvements, however the picture is not the same across the age spectrum.
In early 2025, we released two Top Charts that explored how longevity in the UK and Canada has evolved since the start of the COVID-19 pandemic, showing a notable degredation of mortality rates in working age people. We now expand this analysis to compare this feature in the UK, US and Canada since the turn of the century.
Throughout this article we analyze data from the Human Mortality Database for the US and Canada and the CMI for the UK1, comparing mortality improvements for different age groups across different time periods since the beginning of the 21st century. We see distinct degradation of mortality in working age populations across the three countries that began long before the pandemic. The question we now have is how these patterns will develop into the future? Are we seeing temporary effects, or will they persist?


The slowing of mortality improvements in the 21st century
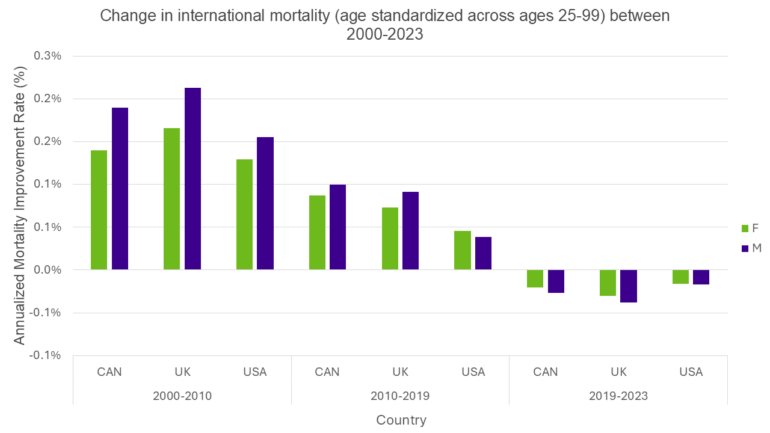
Since the start of the 21st century, we have seen some distinct changes in mortality improvements in the UK, the US and Canada. The chart below shows annualized improvements (i.e., reductions) in adult Age Standardized Mortality Rates (ASMRs)2 for three distinct periods in the 21st century for these countries. When comparing mortality rates averaged over the whole adult population, we see high levels of improvements in the first decade (2000-2010), then lower, but still positive improvements in the second decade up to the COVID-19 the pandemic (2010-2019), then degradation in mortality rates in the period spanning pandemic (2019-2023).
This change in mortality improvements since the turn of the century may not come as a big surprise. The reduction in improvements between the first and second decade has been well documented and corresponds to a slowdown in improvements in cardiovascular disease deaths. The further drop in improvements over the COVID-19 pandemic period again is not a large surprise given the strain on medical services through this period and the introduction of a new major cause of death.
However, focusing solely on average improvements over a large age spectrum misses some of the nuances of how mortality rates have been progressing. There are in fact some distinctly different patterns emerging at different ages.
Mortality degradation for working age people
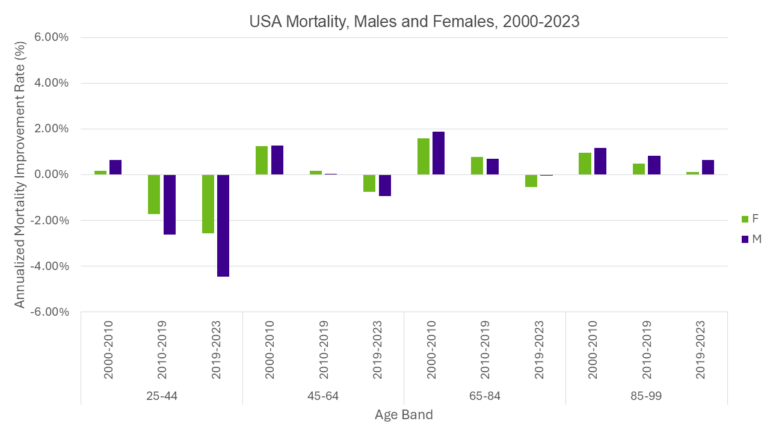
In the following charts we have split the adult population into four different age groups. 25-44 year olds, 45-64 year olds, 65-84 year olds and 85-99 year olds, broadly representing younger working age people, older working age people, younger retirees and older retirees, respectively. Again, we are showing annualized improvements in ASMRs, but this time the age standardization is taken over the specific age band.
In the US and Canada, we see the bulk of the recent mortality degradation has been experienced by working age people, with the biggest degradation being seen in the 25-44 age group. What’s more, is that this degradation actually started well before the pandemic with negative mortality improvements for 25-44 year olds in the 2010-2019 period. When we look at the retiree population, in the recent 2020-2023 period, we generally see lower levels of mortality deterioration in 65-84 year olds and mortality improvements for over 85 year olds.

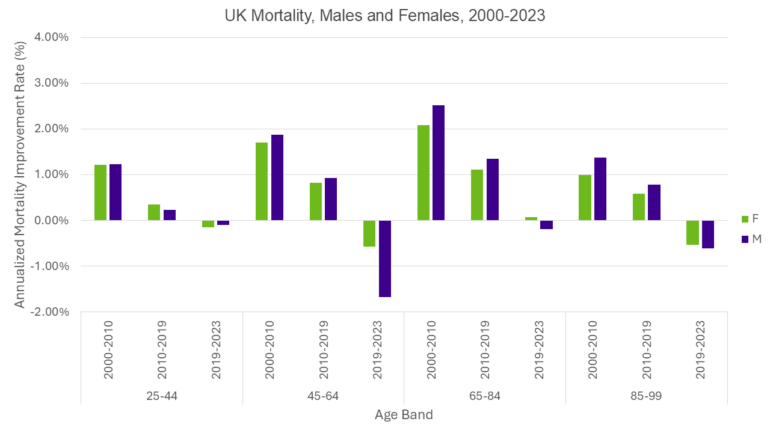
The situation in the UK differs slightly from that in the US and Canada. The majority of mortality deterioration has been observed within the working-age population, but specifically concentrated among individuals aged 45 to 64. However, although the 25-44 age group demonstrated greater resilience during the pandemic, they experienced the smallest improvements in mortality rates throughout the preceding decade. By 2023, younger pensioners had nearly returned to pre-pandemic levels of mortality, whereas older pensioners recovered more slowly. (We note both pensioner groups were actually back on track by 2024).
Age or cohort effects?
Crucial questions for those looking to project changes in future mortality rates are whether and how these patterns will continue in the future. Will the working age mortality degradation continue into the future? Will we see a persistent effect on mortality rates for certain age groups (an “age-effect”)? Will the observed effects move through the age spectrum in the future, impacting the mortality rates of a particular birth cohort as they age (a “cohort-effect”)? Whichever of these features materializes will have a distinctly different effect on future mortality rates for different age groups.
The causes of death driving the degradation of mortality in the working age population are similar across all three countries albeit with subtle differences. Overall, external, preventable and/or non-natural causes of death are overwhelmingly responsible. Accidental drug poisoning and suicide are among the chief drivers, particularly in the USA. Furthermore, homicide, motor vehicle accidents (MVAs), alcohol poisoning, and various cardiometabolic conditions are responsible for most of the remaining excess in all three countries. One study even noted that increasing social isolation and declining companionship are having negative effects on younger age groups3. The data reveal interesting regional variations. For example, deaths due to alcohol and MVAs have remained relatively stable in the UK while their corresponding cause-specific death rates in North America have increased over the past fifteen years. It is also interesting to note that cancer is one area in which the USA does not underperform the developed world. Data in all three countries show that working age females are more likely to die of cancer than their male counterparts. As stated above, however, the degradation in working age mortality can be almost entirely attributed to non-natural, preventable causes4,5,6,7.
From these causes of death, it is possible to paint a picture of either an emerging age effect or an emerging cohort effect. For example, increases in so-called “deaths of despair” (drug overdoses, suicides, etc) in working age people may materialize in persistent long term mental health challenges for this group into their retirement. Alternatively, such deaths may be symptomatic of a society that is becoming harder for working age people to navigate, resulting in a perpetual strain on working-age-groups.
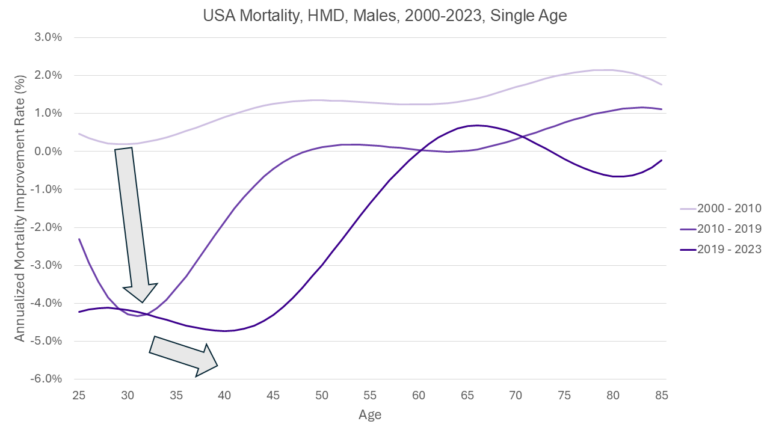
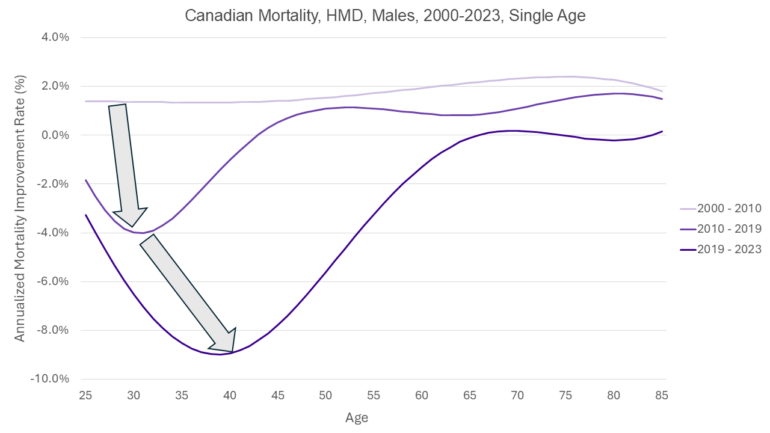
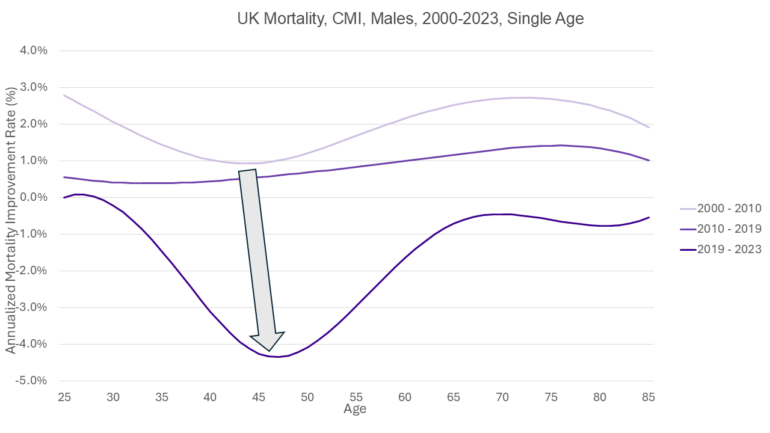
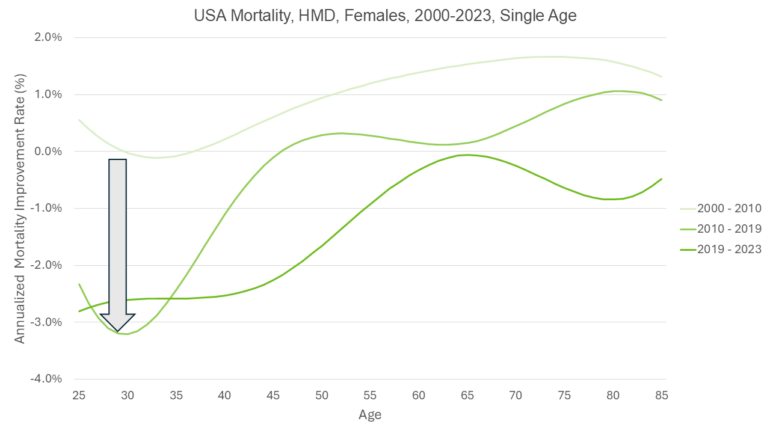
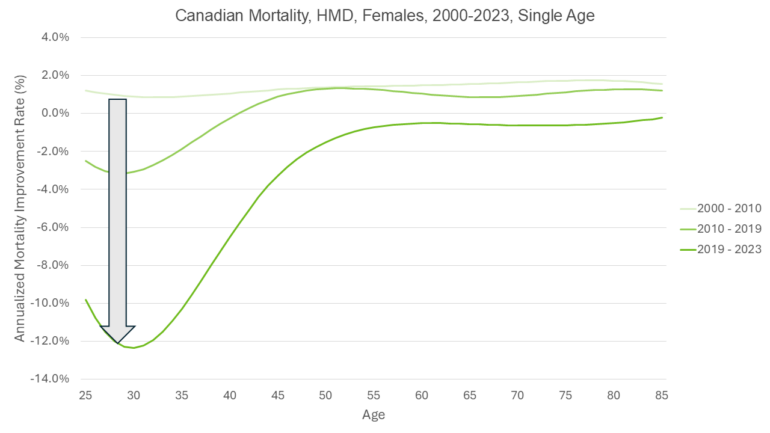
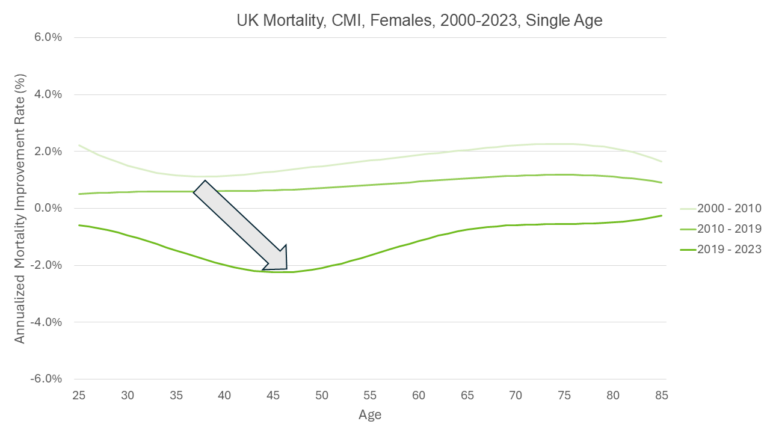
In the next few charts we show the evolution of mortality rates over a continuous age spectrum between 2000-2023 split into the three periods of interest: 2000-2010, 2010-2019 and 2019-2023. Mortality data from the CMI for the UK and HMD for North America was smoothed using a cubic spline and a custom set of knots. The results are expressed as the annualized percentage improvement in mortality for the different ages. We are looking to see if there is any pattern in the progression of troughs in mortality improvements across the three time periods analyzed. If troughs appear at the same age in each time period, it will suggest the emergence of an age effect. If troughs appear to progress along the age spectrum, in particular, 10 years later between 2000-2010 and 2010-2019; and 6 years later between 2010-2019 and 2019-2023, then it will suggest the emergence of a cohort effect.
The interpretation of this analysis is not conclusive, there seems to be slightly stronger indications of cohort effects in the North American male populations and the UK female population. And slightly stronger indications of age effects in the North American female populations and the UK male populations.
US men
Canadian men
UK men
US women
Canadian women
UK women
What does this mean for pension plans and insurers?
Our analysis reveals that in both Canada and the US, mortality rates have been increasing among adults aged 25-44 for over a decade. In the UK, mortality rates for this age group declined until the COVID-19 pandemic but showed the lowest rate of improvement among adults in the decade prior to the pandemic.
Crucial questions for those looking to project changes in future mortality rates are whether and how these patterns will continue in the future. Will the working age mortality degradation continue after the observed period? Will we see a persistent effect on mortality rates for certain age groups? Will the observed effects move through the age spectrum in the future, impacting the mortality rates of a particular birth cohort as they age?
A persistent age effect would mean that working age mortality would continue to be affected in future years, but pensioner mortality would be unaffected. A persistent cohort effect would result in degradation of pension mortality in the next 10-15 years. Cause of death analysis gives us no conclusive indication of what to expect. Our analysis of improvements by age is also inconclusive, pointing slightly more towards cohort effects for North American men UK women, and age effects for North American women and the UK men.
What do you think?
We’d love to know what you think of this emerging experience. Do you think we are seeing the emergence of a cohort effect or age effect for any particular population? Do you think this effect will dissipate entirely in the near future? Please follow us on LinkedIn to join the discussion.
1 [Canadian Data: https://www.mortality.org/Country/Country?cntr=CAN ; USA Data: https://www.mortality.org/Country/Country?cntr=USA ; UK Data: https://www.actuaries.org.uk/learn-and-develop/continuous-mortality-investigation/cmi-working-paper. North America data was first downloaded in March 2025 and again June 2025 when 2023 data became available. UK data was first accessed and downloaded in March 2025.]
2 [Mortality rates were standardized for males and females separately using 2019 population data over 4 age bands: 25-44. 45-64, 65-84, 85-99.]
3 Kannan VD, Veazie PJ. US trends in social isolation, social engagement, and companionship ⎯ nationally and by age, sex, race/ethnicity, family income, and work hours, 2003-2020. SSM Popul Health. 2022 Dec 25;21:101331. doi: 10.1016/j.ssmph.2022.101331. PMID: 36618547; PMCID: PMC9811250
4 Wrigley-Field E, Raquib RV, Berry KM, Morris KJ, Stokes AC. Mortality Trends Among Early Adults in the United States, 1999-2023. JAMANetwOpen. 2025;8(1):e2457538.doi:10.1001/jamanetworkopen.2024.57538 (https://jamanetwork.com/journals/jamanetworkopen/fullarticle/2829783)
5 Statistics Canada. Table 13-10-0394-01 Leading causes of death, total population, by age group
6 Jennifer Beam Dowd, Katarzyna Doniec, Luyin Zhang, Andrea Tilstra, US exceptionalism? International trends in midlife mortality, International Journal of Epidemiology, Volume 53, Issue 2, April 2024, dyae024, https://doi.org/10.1093/ije/dyae024
7 Causes of death over 100 years - Office for National Statistics