


We explore the latest regional data on case numbers for local areas across the UK, highlighting areas of particular concern, as well as areas which appear to be currently more successful in restricting the spread.

Last week our analysis of daily new COVID-19 cases highlighted 68 local authorities in England for which, although they were not on the Public Health England watchlist at time of publication, the growth in new cases and/or the number of new cases had been high, and so were potentially of concern. Of the highlighted authorities, 12 subsequently appeared on last week’s watchlist; most of which were ones we highlighted as being of particular concern. In the meantime, worries about rising case numbers has triggered new restrictions across large parts of north east England, with further restrictions expected to be implemented across north west England imminently. There is also talk of a need for a short period of national lockdown in England for a few weeks in October – although no details have been provided at this stage. In this blog we explore the latest case numbers, consider some of the changes being announced in restrictions to apply in England from next week, along with anticipated changes to the PHE watchlist later today. We also include similar analysis for the other home nations, which highlights some of the drivers behind recent decisions in each of Scotland, Wales and Northern Ireland.
The overall picture on case numbers
The chart below shows the latest case numbers published by the UK government (as at midday on 17th September). The bars show the daily numbers of new COVID-19 cases across the UK, with the line showing the running seven-day average, smoothing through dips in new case numbers which tend to happen for example at weekends.
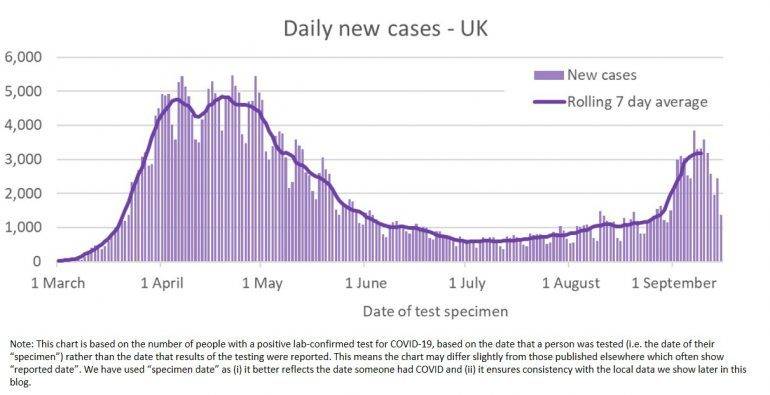
The number of cases across the UK rose rapidly over March, as COVID-19 began to spread though the population. Given testing capacity was very limited initially, it is likely that the ‘true’ infection numbers at that time were much higher. After this initial surge subsided, daily case numbers fell over the summer months, in part as the lockdown restrictions and social distancing measures help suppress transmission rates.
However, case numbers have been steadily increasing for the past few months. Of particular concern is that the rate of increase is now approaching that seen in the initial stages of the pandemic. Over this period the testing capacity has been significantly higher than in the initial period, and has been targeted around potential clusters, so some increase is not unexpected. Nonetheless the direction of travel is giving some cause for concern.
Whilst cases appear to be rising at a similar rate to early in the pandemic, care is needed in making such comparisons. We have much higher testing capacity and are testing more asymptomatic individuals now. The true number of daily new cases in March and April is believed to be an order of magnitude higher than shown on this chart.
There has been a lot of coverage over the past few days in recent issues with delays to obtaining test results due to a surge in demand, caused in part by the reopening of schools and many businesses starting to reopen. We can see in the above chart that cases fall sharply in the most recent days. This is primarily as a result of delays in obtaining results, as the figures are based on the specimen date. We would therefore anticipate that the figures for the past few days will increase.
As a result, in this week’s analysis we have increased the ‘step back’ (the number of days that we moved back from the latest date provided, to what we believe to be a more realistic ‘final’ case count) to 4 days for England.
The focus of attempting to control the pandemic has switched from the initial nationwide lockdown to using more localised approaches, with the intention of only putting in place restrictions in areas where, and for as long as, it is necessary. It is therefore vitally important that local authorities carefully monitor the case numbers, looking for signs that the virus may be becoming more prevalent, to enable them to take appropriate, focussed, localised action.
However, as cases spread, widespread local restrictions covering regions rather than specific authorities is the inevitable next step. We saw this being announced earlier this week for the North East (Sunderland, Tyneside, Gateshead, Northumberland) and today for much of the North West and many parts of the Midlands, where numerous adjacent authorities are causing concern.
We examine below the available data on case numbers for local areas within each of the home nations in turn, identifying areas which are at risk of requiring more localised action in the near future.
Case numbers in England
Public Health England publishes a weekly surveillance report exploring the national and local new COVID-19 cases data for England. One of the outputs of this surveillance is a “watch-list” of local authorities1 which are causing concern, split into three categories:
- Intervention: These authorities have specific restrictions in place which are more limiting than those in place for England generally i.e. there is some form of local restriction (“lockdown”).
- Enhanced Support: The local authority is gaining additional support and resources from central government, including increasing mobile testing capacity.
- Concern: Highlighted as having high prevalence of COVID-19, the local authority is taking additional targeted actions in order to control COVID-19 case numbers. This can include additional testing in care homes and increased community engagement with high risk groups.
Last week we explored the then current watchlist, and set out 68 local authorities which we thought were of possible concern, of whom 16 were causing particular concern, and were at risk of joining the watchlist, due to either high (and statistically significant) growth in the weekly new cases and/or a case rate that was high compared to the national average. Of these authorities, 12 appeared on the latest watch list (10 of whom were on our list of ‘most concern’).
48 local authorities appear on the latest watchlist (published 11th September), covering 1 in 5 of England. In advance of the publication of the watchlist today, we have updated our analysis based on the latest data on cases, and highlight a number of areas which give cause for concern. Many of these areas have already announced local restrictions.
Week on week: A continued migration of authorities to growing new cases
The graphic below shows last week’s chart and this week’s chart side by side. It is encouraging to see that, despite concerns around rising case numbers in some areas, the number of areas which have seen falling case numbers in the latest week (so appear on the left side of the chart) has increased, as has the number of areas with lower case rates than the national average.
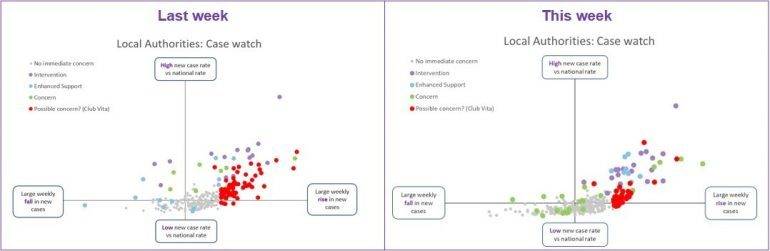
We can see that, based on the latest data, a significant number of areas are what we would classify as ‘possible concern’ (the red dots). A total of 32 local authorities fall in this category, covering some 12% of the population of England. Combined with the 48 areas on the latest PHE watch list, around 34% of England is ‘at risk’. While still high, this is lower than last week, when we estimated around 48% of England could be at risk. Despite adjusting the time period looked at, continued delays may be suppressing the latest case numbers. As such, the reduced estimate of the population at risk of restrictions should be treated with some caution.
Focus on this week: Which local authorities might be of emerging concern?
We enlarge this week’s case watch below, and highlight a number of local authorities and groups of points of particular note.
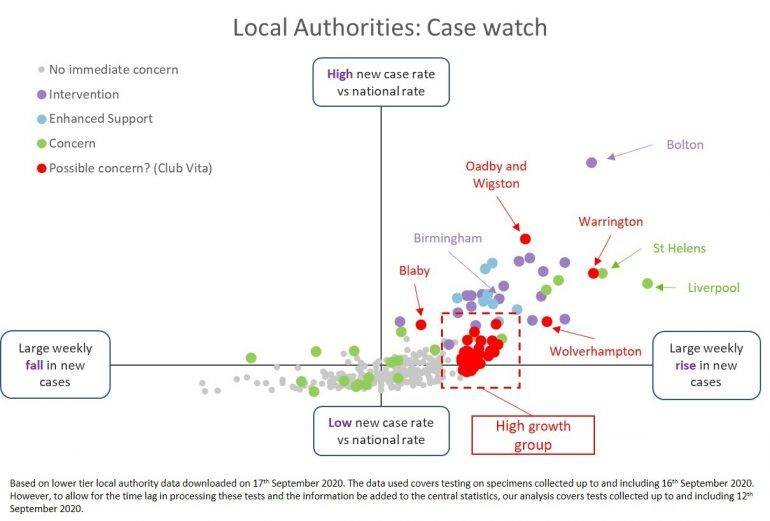
The chart highlights several noteworthy points:
- Bolton continues to demonstrate why PHE reversed the planned easing of restrictions in the face of high, and rapidly rising, new cases.
- Birmingham, which last week was not shown on the chart due to a very large increase in weekly cases (beyond the limit of the horizontal axis), has seen a marked slowdown in the weekly cases. Having introduced local lockdowns last week, it might be early signs of this policy being successful (although we would typically expect it to be several weeks before the full benefit is seen).
- Liverpool and St Helens are showing why PHE moved them to ‘Concern’ status in the latest watch list, as they continue to see high case numbers. Nearby Warrington, which is not on the official watch list, is likely to be being carefully monitored, and is part of the swathe of authorities in the North West subject to additional restrictions from Tuesday 22nd September.
- Oadby and Wigston in the Leicestershire area is also causing concern due to its high case rates. As we were finalising this blog news was coming through that it would be joining neighbouring Leicester in having a local lockdown, which is unsurprising. However, it highlights the volatile nature of local outbreaks, as Oadby and Wigston were taken off the watch-list only last week.
- Wolverhampton and Blaby (near Leicester) remain in our possible concern category due to relatively high case rates (and in the case of Wolverhampton, high increase in cases). Wolverhampton, like Oadby and Wigston, is part of the group of local authorities in the Midlands subject to additional restrictions from next week.
- High growth group: Many of the local authorities in the high growth group have relatively low new case rates – at or close to the national level (the red box in the chart). These authorities are showing as a possible concern due to a relatively high rises in cases in those areas. The growth seen recently may be simply a localised outbreak in the area, or it may indicate more widespread growing community transmission. In these areas we imagine the local public health officials will be working closely with the local authority to identify the source of the growth in new cases.
- Restrictions having the desired effect: In more welcome news, a number of areas on the PHE watch list have seen falls in case numbers more recently – suggesting the additional restrictions but in place have been having the desired effect of reducing rates of transmission in those areas. Hopefully, the regional restrictions now being introduced can halt the growth in cases in the areas that remain of concern.
Case numbers in Scotland
Whereas England saw the first local restrictions introduced to Leicester at the end of June, the first local restrictions in Scotland were imposed in Aberdeen on 5th August. While the restrictions in Aberdeen were recently lifted, local restriction were brought in across a wide part of the Glasgow area from the start of September. Most recently, North Lanarkshire and South Lanarkshire, again both in the Glasgow area, became the latest to introduce localised lockdowns from 12th September, bringing the total number of areas in Scotland with local restriction to seven. In addition, the phased easing of restrictions also mean greater national restrictions remain in place in Scotland than in England, for example on the opening of non-essential offices.
We have updated our analysis of the daily case data for Scotland, as published by Public Health Scotland, split by the 32 Council Areas. While there is no Scottish equivalent of the PHE watch list used in England, we nonetheless highlight areas with local interventions currently in place, as well as those areas where new case numbers / growth in new cases is of concern.
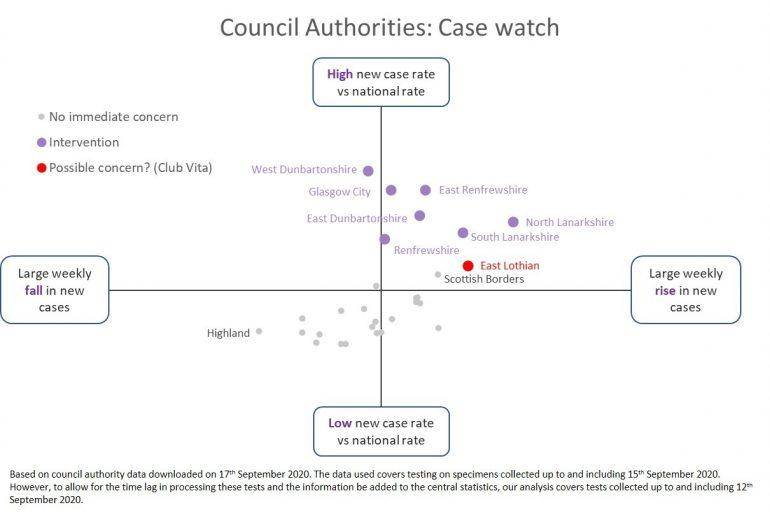
We can see that:
- It is clear why North Lanarkshire and South Lanarkshire introduced similar localised restrictions to neighbouring Glasgow based regions, given the high case numbers and case rates. South Lanarkshire was one of the areas that we were concerned about last week.
- The five other Glasgow based regions with localised restrictions (Glasgow City, East Renfrewshire, East Dunbartonshire, West Dunbartonshire and Renfrewshire) still have relatively high rates case rates. However, it is encouraging that, whilst cases continue to grow in some of these areas, they are doing so more slowly than last week, suggesting that the restrictions may be beginning to have the desired effect.
- East Lothian has seen a relatively large increase in cases over the past week, although the case rate itself is close to the national average.
- The South Borders has seen a relatively large increase in cases over the past week. Given the proximity to Northumberland in England, which has introduced localised lockdown this week, residents have been encouraged to only travel to England for essential purposes.
- Highland, which was causing concern last week, has seen a large fall in cases, which is welcome news.
- The number of areas appearing in the bottom left quadrant is very welcome, as those are areas where the case numbers appear, at least for now, to be under control.
Case numbers in Wales
Caerphilly saw the first local lockdown in Wales from the evening of the 8th September, and just as we were finalising this blog Rhondda Cynon Taf, a neighbouring area, became the second Welsh region to bring in localised restrictions. Whilst businesses can remain open, households can only meet up outside, and the area is in “lockdown” in that travel in and out of the area is not permitted without a “reasonable excuse”.
We have updated our analysis of the daily case data for Wales, as published by Public Health Wales, split by the 22 Local Authorities. While there is no Welsh equivalent of the PHE watch list used in England, we nonetheless highlight in the chart below areas with local lockdowns/interventions, as well as those areas where new case numbers/growth in new cases is of concern.
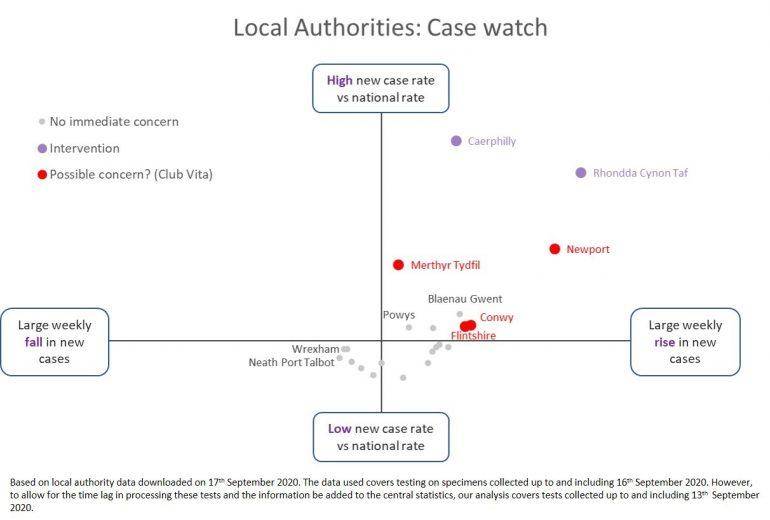
In particular, we can see that:
- We can see why Rhondda Cynon Taf has now joined its neighbour Caerphilly in imposing local lockdown, given the high case numbers and rate of growth. We had highlighted Rhondda Cynon Taf as an area of particular concern in last week’s analysis.
- Merthyr Tydfil remains an area of concern given its high case rate. Given its proximity to both Caerphilly and Rhondda Cynon Taf, it will need to be monitored carefully.
- Two further areas, Conwy and Flintshire, are causing concern given the relatively large increase in cases, although case rates remain close to the average for Wales. While marginally below our threshold for the weekly increase in cases, Blaenau Gwent is also an area to keep an eye on.
- In better news, Wrexham and Neath Port Talbot, which were causing concern last week, look to be in a much better position based on the latest data, with falling cases.
Case numbers in Northern Ireland
On 10th September the Northern Ireland Executive announced that additional localised restrictions were being brought in for specific areas for the first time in Northern Ireland. Rather than implementing restrictions across specific Local Government Districts, they were targeted at more granular areas. The initial restrictions included the Belfast area, Ballymena, and some other specific postcode areas. This has now been extended to further areas such as Dundonald, while an interactive map shows details of the over 10,000 postcodes which are covered by the latest restrictions. As we were finalising this blog, the BT60 postcode area was added to the list of restrictions.
Our analysis of the daily case data for Northern Ireland, as published by the Department of Health, split by the 11 Local Government District is shown below. While again there is no equivalent of the PHE watch list used in England, we nonetheless highlight areas of concern.
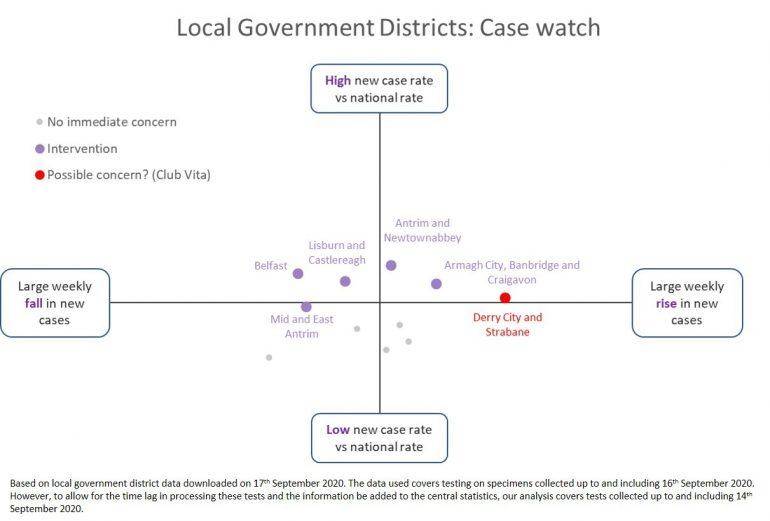
We can see that:
- The more than 10,000 postcodes which are now under localised restrictions are spread across five different local government districts (Antrim and Newtownabbey, Armagh City, Banbridge and Craigavon, Belfast, Lisburn and Castlereagh, and Mid and East Antrim) At the local government district level these areas do not appear to be particularly concerning, given the relatively low, and in some cases falling, case numbers in the latest data. However the local health authorities have been able to drill down to a more granular level, as so will be able to better target local areas which are causing concern.
- Derry City and Strabane is also likely to be causing concern to the local authorities, given the relatively high rise in case numbers.
Direction of travel
The direction of travel for new cases continues to cause concern. Several more authorities in England will be added to the PHE concern list on Friday, while a number of additional areas across the UK are also giving us cause for concern. However, there is some seemingly good news in that many regions are seeing falling case numbers. This highlights the need for, and benefit of, localised action to target areas of particular concern, as opposed to more widespread national lockdowns.
We will continue to monitor our “case watch” over forthcoming weeks.
Notes:
1. For those familiar with the English local authority system these are “lower tier” local authorities – the smallest regional unit where data is readily (and publicly) available.