


In this week’s blog we explore the latest weekly deaths data for the UK, covering deaths registered in the eighth week of 2021. Total deaths registered fell for the fourth consecutive week. This was driven once again by another marked reduction of around 28% in deaths mentioning COVID-19, when compared with the previous week.

COVID-19 linked deaths are now at a similar level to December. Despite this latest fall, COVID-19 linked deaths accounted for some 22% of registered deaths over the week, and overall deaths remain at relatively high levels, at around 9% above the seasonal average. However this is a much more encouraging picture than we saw in January.
The latest data also shows continued falls in daily case numbers and hospital admissions, as well as deaths. The rate of reduction in case numbers increased again over the past week, after showing signs of levelling off towards the end of February. We would expect this trend to feed through to hospitalisations in the next week or so, and ultimately deaths in the few weeks after that. Therefore, it will be important to keep an eye on these statistics in the coming weeks, whilst also examining the impact of the continuing vaccine rollout, as well as the easing of some lockdown restrictions, including the return of schools.
COVID-19 in the UK: Current position
COVID-19 case numbers continue to grab the headlines. While many cases show only relatively mild symptoms, and some are entirely asymptomatic, there will unfortunately be a proportion who will require hospital treatment and potentially intensive care. Sadly, while medical treatments continue to improve, a number of those admitted to hospital will tragically die. The progression from first infection, to developing serious symptoms requiring hospitalisation, to death occurring typically takes a number of weeks.
It is therefore very useful to look at the numbers of COVID-19 cases as an indicator of imminent hospitalisation requirements, and to look at hospitalisation figures themselves as an indicator of future rises in COVID-19 linked deaths.
The chart below compares these three figures for the UK as a whole (averaged over the 7 days to the date shown to smooth out variations, such as weekends and bank holidays). We have focussed on the figures for the past few months, given the very low levels of COVID-19 seen over the summer months.
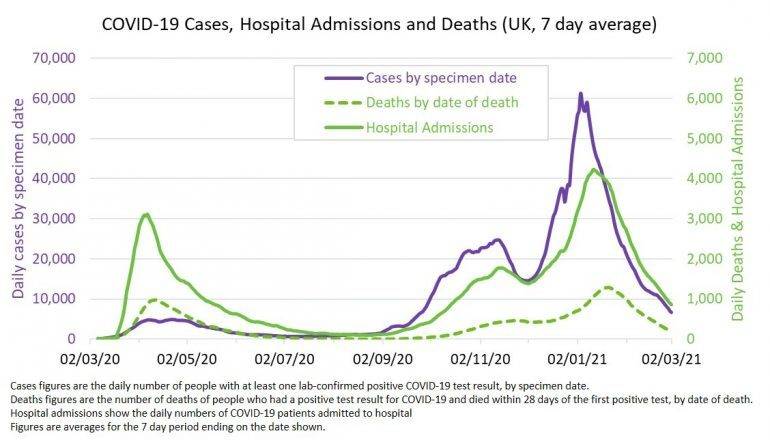
We can see how COVID-19 cases in the UK (purple line, left hand axis) increased steadily from early September, then more rapidly from the start of December, reaching a peak around the turn of the year. Since early January, case numbers have fallen fairly rapidly, which is welcome news. The rate of the fall in deaths has increased again this week after indications of a slowdown over the previous week or two. This is an encouraging sign, though it will be monitored closely in the coming weeks, given the timetables for lockdown restrictions to be gradually lifted.
There will not always be a direct correlation between cases and hospitalisations (solid green line, right hand axis), for example due to changing rates of infection across different age groups, who are likely to have differing levels of hospitalisation. However, hospitalisations (green line, right hand axis) have broadly followed case numbers (with some anticipated time lag) in the chart. While numbers also remain high, they have also been falling rapidly over recent weeks to under 1,000 daily hospital admissions across the UK this week. There are not yet signs of the recent levelling off of case numbers having an impact on the rate of fall in hospital admissions, though this is something to look out for. Given the evidence that vaccines significantly reduce hospital admissions, we will hope to see a continued fall in hospitalisations.
COVID-19 deaths (dashed green line, right hand axis) are also following similar patterns, although the rate of increase since early December was less dramatic and closer to that seen over November. Note that, unlike in the rest of this blog, these death figures are based on date of death rather than date of registration, and count deaths within 28 days of a positive COVID-19 test. Deaths on this measure continue to fall steadily, which is very welcome news.
Weekly deaths remain above average seasonal levels
The latest statistics from the ONS include detailed breakdowns of deaths registered in England & Wales up to 26th February 2021. Combining this information with similar data from the corresponding statistical bodies in Scotland and Northern Ireland, we can examine emerging patterns in the data.
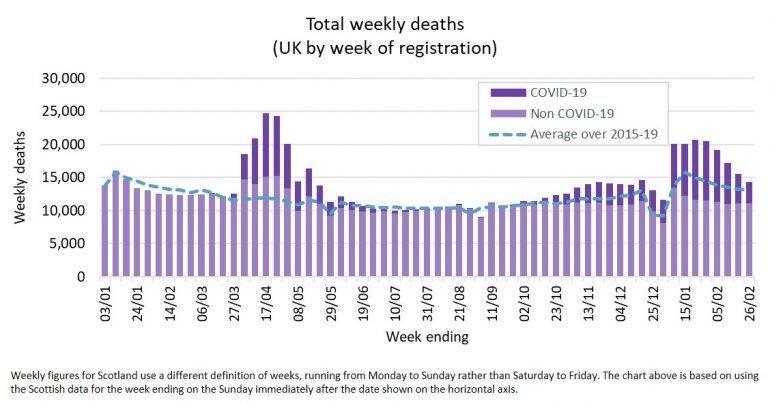
Total weekly deaths registered in the latest week were around 8% lower than in the previous week, which was a bigger drop than we would expect for the time of year. The level of excess deaths also fell but is still around 9% higher than would be expected, based on the 5 years from 2015 to 2019. The reduction in excess deaths since the start of the year is very welcome news.
Deaths directly attributable to COVID-19 have again fallen sharply
We focus on deaths where there is any mention of COVID-19 on the death certificate in the chart below.
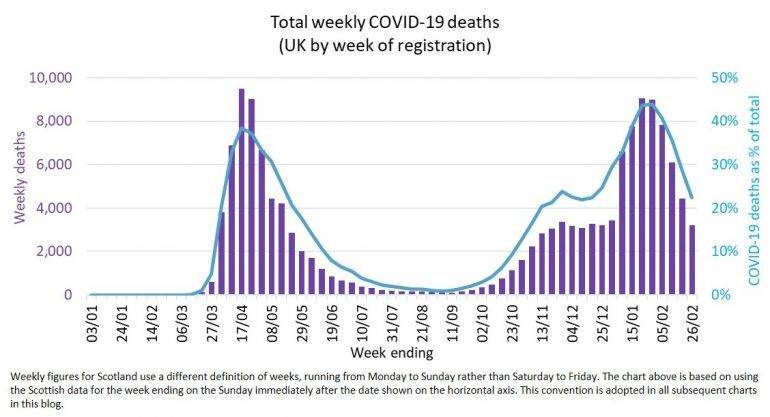
The number of registered deaths which mention COVID-19 on the death certificate increased rapidly at the start of 2021. It is therefore encouraging to see that COVID-19 deaths have again fallen sharply, with a drop of around 28% over the last week, so that levels are now similar to those seen before Christmas. Deaths mentioning COVID-19 still accounted for over 22% of all deaths registered over the week, though this is decreasing on a weekly basis. This demonstrates that, while there is still some way to go, the direction of travel is encouraging.
Deaths excluding those linked to COVID-19 continue to be below average levels (compared to 2015-2019), as can be seen from the chart below.
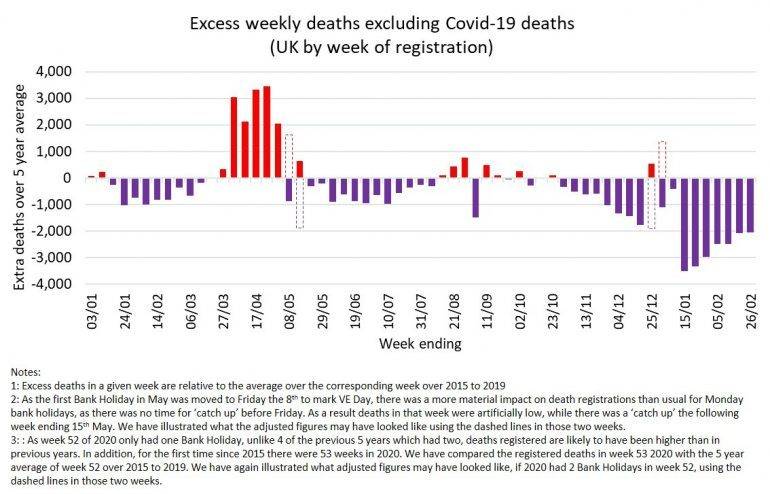
The bars shaded in red indicate weeks where total deaths were above average seasonal levels. This effect was particularly evident at the same time as the COVID-19 pandemic first hit the UK over April and May and was explored as ‘missed’ COVID-19 linked deaths in our earlier blog.
While the weeks around the turn of the year were impacted by variations in the timing of festive bank holidays, the latest week again saw non COVID-19 deaths that were significantly below expected levels. The extent to which the numbers were lower than average appears to be dropping steadily over the past few weeks, although care should be taken in interpreting these patterns over relatively short periods.
What is the position for the year to date?
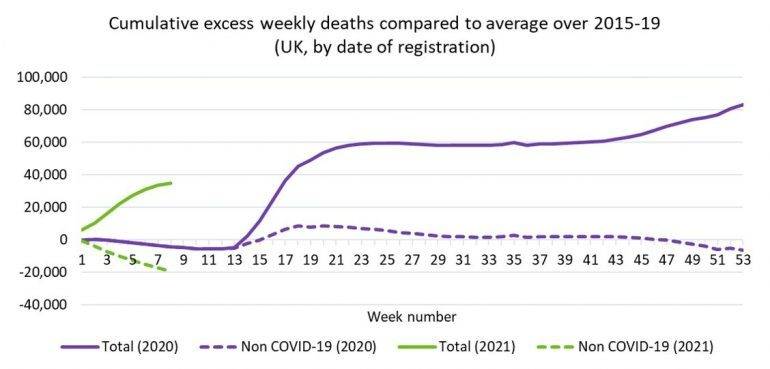
After a relatively light start to 2020, cumulative deaths in the UK rose rapidly over April and May, and by mid-June cumulative deaths for the year to date were almost 60,000 higher than the corresponding weekly average values over 2015 to 2019 (the solid purple line in chart above). For much of the summer the cumulative excess mortality was relatively stable, as weekly deaths were close to average levels. However, the resurgence in deaths over autumn and into winter resulted in a cumulative total of around 83,000 ‘excess’ death for the year.
As discussed above, the start of 2021 saw a rapid rise in deaths, driven by the continued resurgence in COVID-19 linked deaths. For the year to date (the solid green line in the chart) cumulative ‘excess’ deaths (again relative to 2015 to 2019) are already close to 35,000, though encouragingly they may be starting to level off.
The impact of COVID-19 can also be seen in comparing the equivalent figures excluding COVID-19 linked deaths (the dashed lines). On this measure, 2020 was actually a relatively light year, and 2021 has seen even lower non-COVID deaths.
We will be monitoring how these figures evolve over the next few weeks and months. As noted above, while cases, hospitalisations and deaths continue to fall, they all remain uncomfortably high. We are sadly likely to see further tragic COVID-19 deaths, and concerns remain that the impact of disruption to healthcare services during the pandemic may have consequences in the short to medium term. Offsetting that, the hope is that the continued rollout of vaccinations will help stem case levels, hospitalisations, and ultimately, deaths.
“All of the team at Club Vita wish to extend our condolences to anyone who has personally been touched by bereavement in recent months. We know that these deaths leave behind people who are missing loved ones. Our thoughts are with you…”