


In this article we take a closer look at weekly deaths data in the UK for the first three quarters of the year. 2022 is shaping up to be another unusual year for UK mortality. By the end of September, total ‘excess’ deaths exceeded 20,000. However, deaths mentioning COVID-19 over this period were relatively low.

What is the position for the year to date?
The chart below captures how weekly deaths throughout 2022 (up to the end of September) compare to the distribution of weekly deaths in the five years before the pandemic. The blue bars highlight weeks where we saw more deaths than the average for that week over 2015-2019, the green bars show weeks where we saw fewer deaths than the average for that week over 2015-2019. Whereas the winter saw fewer deaths than expected, the situation reversed during the summer.
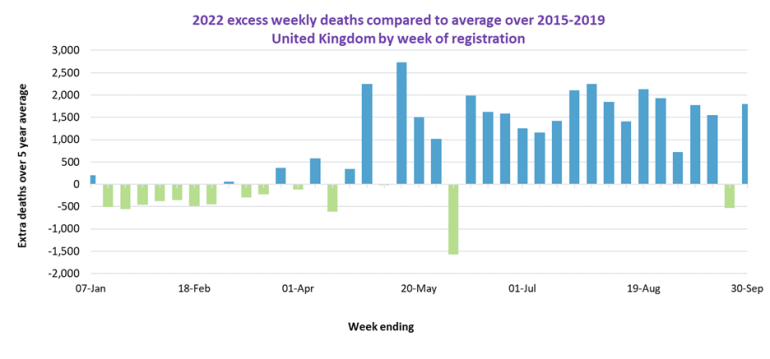
Sources (data available at 14 October 2022) : ONS weekly deaths data, NRS (Scotland) weekly deaths data, NISRA (Northern Ireland) weekly deaths and GOV,UK daily deaths for UK & Nations.
How does this compare to 2021 and 2022?
The next chart shows the number of deaths registered in the UK each week from the week ending 3 January 2020 through to the week ending 30 September 2022. The purple and blue bars show deaths recorded as COVID related, and the green bars show other deaths. The dotted line shows the average number of deaths for each week based on the previous five years.
The chart shows two distinct waves of ‘excess’ deaths. The first wave during spring 2020 and the second wave in winter of 2020/21, due to COVID-19. From the beginning of July 2021 until the week ending 24 December 2021 more deaths were recorded than the previous five-year average. The majority of these ‘excess’ deaths mentioned COVID-19 on the death certificate. 2022 began with lower mortality than usual for the time of year. Unfortunately, the low mortality trend did not continue. Spring and summer of 2022 gave rise to more deaths than typical for those seasons. The majority of these excess deaths did not mention COVID-19 on the death certificate.
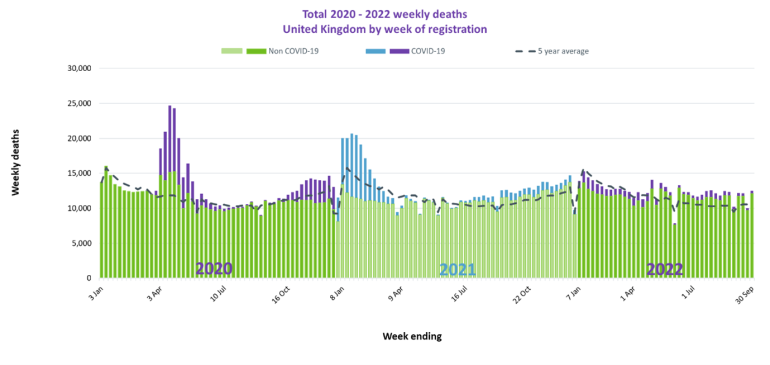
Weekly figures for Scotland use a different definition of weeks, running from Monday to Sunday rather than Saturday to Friday. The chart above is based on using the Scottish data for the week ending the Sunday immediately after the data shown on the horizontal axis. Sources (data available at 14 October 2022) : ONS weekly deaths data, NRS (Scotland) weekly deaths data, NISRA (Northern Ireland) weekly deaths and GOV,UK daily deaths for UK & Nations.
What does this mean for cumulative deaths?
The next chart shows the cumulative weekly deaths in the UK for 2020, 2021 and 2022, relative to the average over 2015 to 2019. Note that the aging UK population means we would expect the number of deaths to increase slightly each year, all else being equal.
The purple lines show the 2020 experience, the blue lines show the 2021 experience, and the green lines show the 2022 experience. The dotted lines relate to non-COVID-19 deaths. The solid lines relate to total deaths. The gap between the solid line and the dotted line of the same colour gives an indication of the proportion of total deaths that relate to COVID-19 in that year.
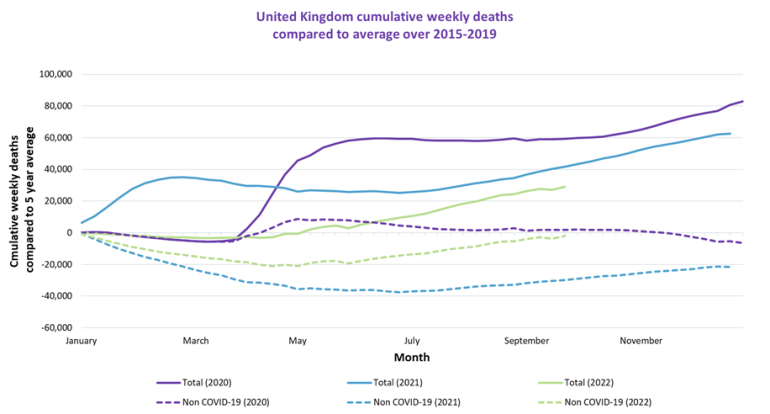
After a relatively light start to 2022, cumulative deaths in the UK rose rapidly from May onwards (the solid green line). By the end of September, the cumulative ‘excess’ UK deaths exceeded 20,000 – this compares to over 80,000 and 60,000 ‘excess’ deaths over 2020 and 2021 respectively (comparing the solid green line with the solid purple and solid blue lines).
While the number of death certificates mentioning COVID-19 in 2022 have been relatively low (c5%), deaths arising from other causes have been rising rapidly from June (the dotted green line). Time will tell whether this pattern continues into the winter season, where we typically see higher mortality than over the summer.
We will monitor the changing situation over the months ahead to understand the impact on future DB pensioner life expectancy.
What do you think?
Let us know in our LinkedIn discussion group Friends of Club Vita.