


The early results from the 2021 census are again showing significantly fewer older people than the ONS estimates, with around 9% fewer 90+ year old men than expected. What has happened to these people and why does it matter?
This is not the first time that census results have highlighted some disparities between the newest estimates and those that were expected. In 2011, Club Vita reported on the case of the vanishing nonagenarians, where the 2011 census revealed 15% fewer men in their nineties in England and Wales than had been projected by rolling forward those aged 80+ from the 2001 census.


What has happened?
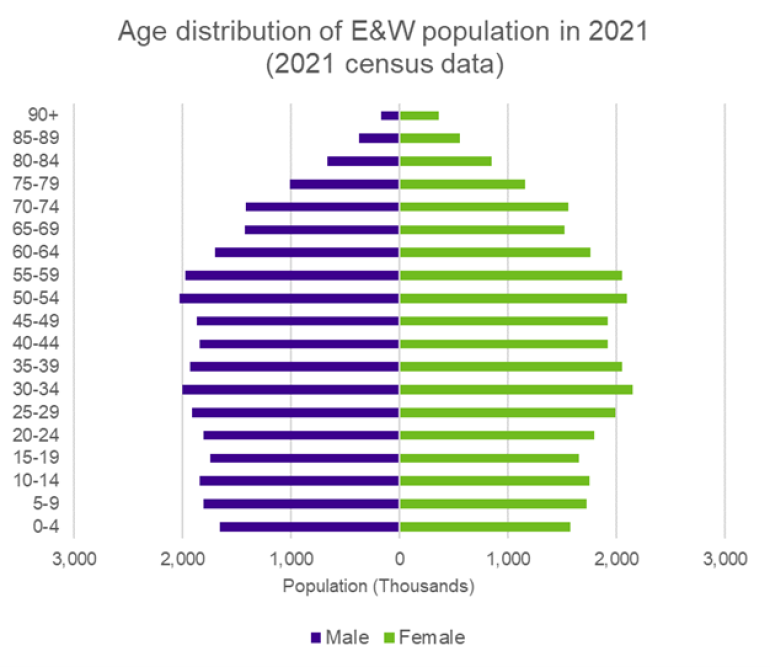
The ONS has today (28th June 2022) published the initial results from the 2021 Census, setting out population and household estimates for England & Wales (the Census was delayed until 2022 in Scotland). These initial figures are provided at a local authority level, split by gender and 5-year age bands (based on age last birthday on Census Day – 21 March 2021).
Comparing these figures with previously published estimates of the expected mid-year population[1], we can see some marked variation across the age bands. Of particular interest to pension schemes and insurers are the older age bands, where we see lower numbers of lives than expected, particularly for men. While the level of discrepancy (around 9% for men aged 90+) is lower than the 15% seen last time, it nonetheless merits investigation.
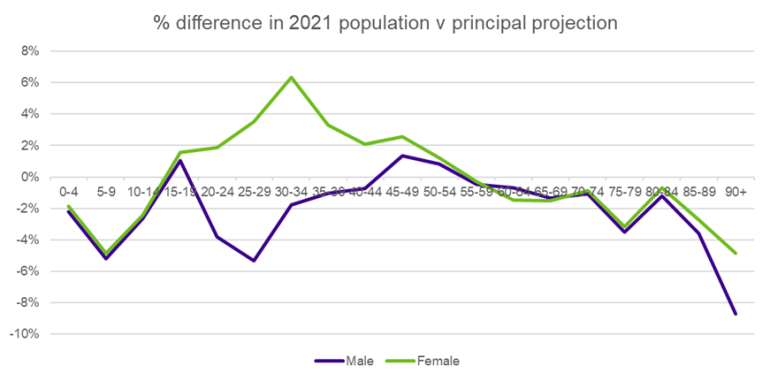
[1] The census data is as at 21 March 2021, whereas the population estimates are as at 30 June 2021. Therefore, we might expect some variation due to these timing differences – for example some people will die in the intervening period, and some will have a birthday so potentially move age band. We have not made any adjustment in our analysis to reflect this variation and would not expect it to materially change the conclusions.
Why has this happened?
The UK government does not track the exact population living in the UK. Every 10 years the Office of National Statistics (ONS) conducts a nationwide census of every household, which estimates the size and makeup of the population. In the interim years, the ONS rolls forward the previous census figures, making allowances for aging, known deaths and births, estimated migration and changes in special populations such as the armed forces and prisoners. These estimates form the annual population figures released by the ONS. In addition, the ONS produce projections of these estimated populations into the future.
The number of births and deaths recorded each year is relatively reliable (new parents can’t access healthcare for their babies without registering them and next of kin can’t bury or cremate a loved one without a death certificate). However, the accuracy of the census itself is likely to have a larger margin of error (due to, for example, not everyone completing the census, potential double counting of individuals, unregistered migrants, or errors in either completing the forms or recording the results). Any over- or under- estimation in the census population data at a particular age will therefore persist as that group ages through the population estimates over the following decade.
And because the number of people still alive at each age gets smaller as age increases (partially offset by any net immigration), any percentage mis-estimation during the census year grows as time passes. For example, an error of 12,000 men at age 80+ could amount to around a 1% error, but with a shrinking pool of people, an error of 12,000 men at age 90+ looks seven times larger with a 7% error!
Errors in the estimated populations at different ages will have a wide range of consequences, for example impacting on decisions around health care, education provision, and other council services. From a pension scheme or insurer perspective, we are most interested in the impact on mortality rates and the rate of improvement in mortality.
What does this mean for mortality rates?
Mortality rates are essentially calculated as a fraction. We take the number of people that died over a given period (the numerator) and divide it by the number of people who were alive over the same period (the denominator). If the denominator references a bigger (or smaller) population than the numerator, then we will underestimate (or overestimate) the true mortality rates – as effectively these ‘extra’ lives can never be recorded as deaths.
What’s more, if this error in population estimates compounds over time (as with the census data) then the associated misestimation of mortality rates will grow year on year, showing faster (or slower) improvements in mortality rates than are actually occurring. Using a consistent data set for deaths and lives is very important for mortality statistics!
This issue has lately become a hot topic in the US, due to the Society of Actuaries recently calibrating their mortality improvement model to two different data sets. This highlighted the differences in improvement rates that can occur due to differences in approach to the projection of population figures. We explored this is issue in greater detail on a webinar last year.
At Club Vita we gather, and validate, individual data from member pension schemes each year. Therefore, we do not have the same concerns around misestimates of population numbers that the ONS have, so we can be confident that our derived mortality rates are a true reflection of scheme experience.
Why is it important for pension schemes and insurers?
Pension schemes and insurers would not typically use population level experience when setting current (or ‘baseline’) mortality rates – these would be set by reference to more relevant experience, such as the pension plan data gathered by Club Vita.
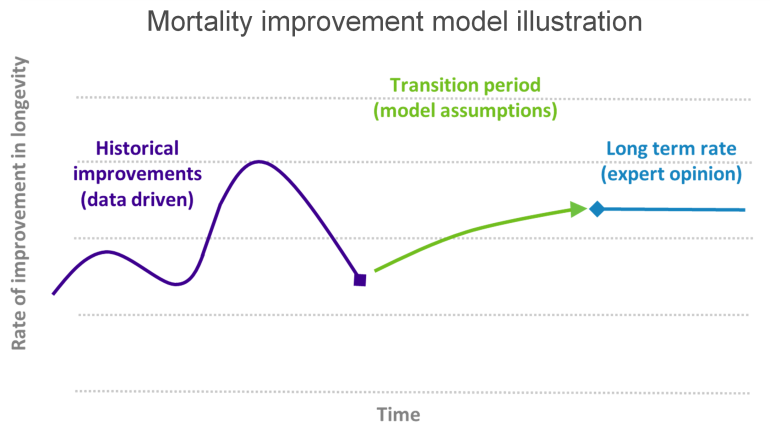
Historical population level mortality improvements are, however, important when considering how life expectancy might evolve over time. They help inform the “jumping off point” from which expected improvements are projected. In particular, England & Wales population data is central to the models that UK actuaries use across the industry to set mortality improvement rates (along with other considerations such as the socio-economic profile of the scheme involved), so there will be impacts on the projected future costs of pensions, benefits and insurance contracts of any misestimates involved.
The impact on liabilities can be material – a 1% increase in historical improvements could increase pension scheme liabilities by around 2-4%.
While it will be some time before more detailed, single year, data is available from the 2021 Census, these initial results are a reminder that actuaries should be very careful when relying on ONS population estimates!