


2019 finished with record lows for UK mortality rates and significant improvements from 2018, despite relatively heavy rates in Q4. We explore below what the latest data tells us about the year just gone, and the implications for pension schemes.
6 February 2020
In my previous blog I discussed how, after a number of years of relatively high deaths, the emerging experience of 2019 was relatively light. This experience was driven in part by a very mild winter, and limited flu impact, as well as a noticeable absence of “NHS in crisis” media headlines.
Several successive versions of the CMI’s mortality projections model have resulted in reductions in the assumed rates of mortality improvement, and so reductions in pension liabilities. However, I estimated that if the trend over the first part of the year continued we could see a change in direction in the next version of the model (CMI_2019), with liabilities potentially increasing by upwards of 1%.
Therefore, the key question is what was the experience over the last quarter, and, in particular, did this dampen the overall reductions in deaths over the year?
The latest data on population experience

The weekly deaths statistics for England & Wales, published by the ONS, provide a useful ‘temperature check’ on emerging trends in longevity.
In considering weekly death numbers, it is important to also allow for the expected impact of the aging population. If mortality rates remain unchanged, we still expect the number of deaths to increase by 2-3% from one year to the next. For deaths to fall we therefore have to experience relatively strong improvements (reductions) in mortality rates to counteract the impact of ageing.
The CMI have now published the latest version of their quarterly Mortality Monitor, covering their analysis of the ONS data for 2019 (to the end of week 1, 3 January 2020). This analysis focuses on standardised mortality rates (SMR), which control for changes in age profile of the population over time. These rates are a useful way to quickly compare changes in mortality rates over time, although clearly some of the finer detail of age-based trends can be lost as a result of standardisation.
The main headlines from this edition are as follows:
- The annual centred average SMR (the rolling average of weekly SMRs over successive 53 week periods) reached the lowest value since weekly deaths data became available earlier in the year, and has remained around this low level;
- The quarterly centred average SMR (the rolling average of weekly SMRs over successive 13 week periods) has continued to be relatively low;
- The cumulative SMR over 2019 was lower than in any of the last 19 years; and
- Following low improvements over 2017 and 2018 (which saw improvement rates close to zero), the cumulative annual standardised mortality improvement for 2019 finished at 3.6%.
What this means for pension schemes
In my previous blog I estimated that core CMI_2019 might see some ‘bounce back’ relative to CMI_2018 under core settings, with increases in annuity value of between 0.3% and 1.4% depending on how Q4 turned out. With all data underpinning the CMI_2019 model now available, we can follow the CMI’s outlined methodology and get a sneak peek at what CMI_2019 is expected to look like.
The chart below looks at the expected annuity values that we may see in CMI_2019, on a range of smoothing parameters (Sκ). We also show corresponding values for the periods underpinning the previous variants of the CMI model, which show the downwards trend over the last few years.
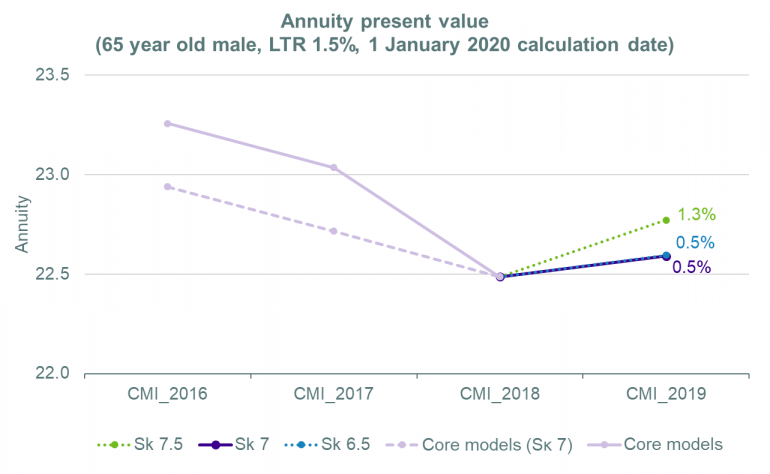
Note: The annuity values shown are for men at age 65, based on the S3PMA base table, with a net interest rate of 0% p.a. and assuming a long term rate of 1.5% p.a. in each case. Calculations were carried out using the published CMI_2018 model, and the E&W population data included with that model. CMI_2019 values are estimated based on fitting the model to 1979 to 2019, where the exposures and deaths in 2019 have been estimated in line with the CMI’s published methodology. The calculation date is set to 1 January 2020 throughout.
Under core settings it is likely that there will be some ‘bounce back’ to higher annuity values (and so liabilities) in the published CMI_2019 model (assuming no further changes to core settings). Schemes which have been adopting core values without adjustment will therefore see a slight increase in liabilities.
Interestingly it appears that while increasing the value of Sκ from the core value of 7.0 to 7.5 increases the annuity value (as it smooths out more of the dip in improvements seen over recent years), decreasing it down to 6.5 has very little impact (as the strong 2019 offsets the weaker improvements see in previous years).
The question now turns to whether 2019 is the start of a reversion to previous high rates of improvement, or just another temporary blip. We will of course be continuing to monitor emerging experience over the weeks and months ahead.
This report complies with the requirements of Technical Actuarial Standard 100 as effective from 1 July 2017.
Mortality Monitor Q4 2019
Download a print friendly version of this article.