


Question:
Do post-COVID data influence pre-COVID mortality trends?
Answer:
If we are using the core parameterisation of the CMI_2022 Mortality Projections Model, then the answer is yes.
On the face of it, we might not expect post-2019 data to tell us very much about pre-COVID trends. However, under the core version of the CMI_2022 Mortality Projections Model, post-2019 data has changed our measurement of trends in life expectancy growth occurring before the pandemic. This is because the model smooths out historical mortality improvements experienced in individual years – so introducing very low improvements in 2022 will reduce the smoothed improvement rates for 2019 and before.
In the chart below, we see that allowing for 2022 data reduces our estimate of smoothed 2019 life expectancy by around a month.

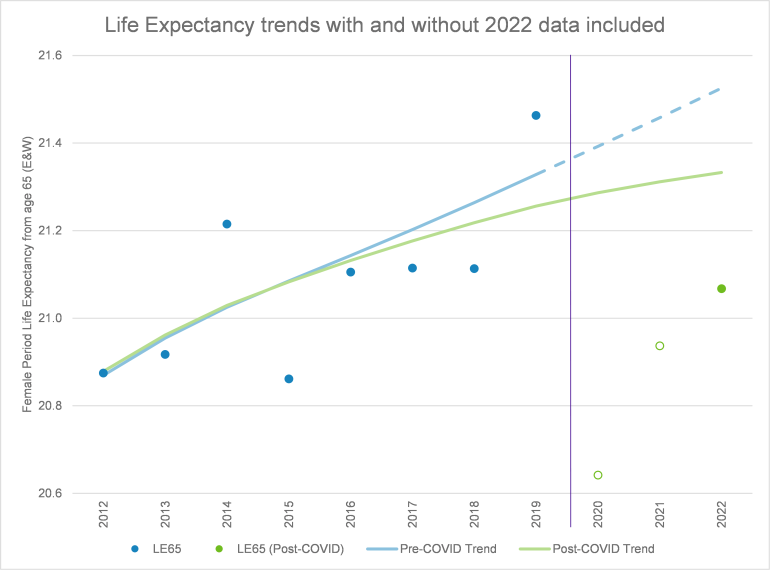
Source: Club Vita calculations based on the CMI_2022 published model, using data following the 2021 census updates. The blue line shows CMI_2022 with the calibration period set to 1979-2019, but otherwise with core settings. The green line shows core CMI_2022, with 25% weight assigned to 2022 data (and no weight to 2020 or 2021 data). In each case the long-term rate is set to 1.5% pa. LE65 refers to period life expectancy at age 65 based on one year of data.
Key takeaways:
- Our estimates of historical longevity trends are not set in stone but can evolve over time as more years of data are added, or as historical data is revised.
- Allowing for post-COVID data in our longevity projections can materially impact our estimates of smoothed pre-COVID longevity trends.
Why does this matter?
Whilst the main use of longevity projections is to estimate future improvements in life expectancy, actuaries also make use of the smoothed historical rates in their work to estimate mortality rates applicable in different calendar years.
Base tables are usually expressed as applying in a particular calendar year. For example, the S3 family of tables published by the CMI apply in 2013, and the latest edition of Club Vita’s VitaCurves, CV23, apply in 2020. When carrying out an experience analysis versus a selected base table, the mortality rates used in years other than the base year are often calculated by applying an improvement assumption.
Using core CMI_2022, with a 25% weighting to 2022 data, rather than a 0% weighting to 2022 data reduces smoothed mortality rates in 2019 by up to 2%. This can have a knock-on impact on things like the results of experience analyses.
The situation may be even more pronounced once CMI_2023 is published. The CMI has stated an intention to place 50% weight on 2023 data, and based on current expectations of overall mortality for 2023, this is likely to pull longevity projections down even further.
Therefore, if your longevity base table assumptions rely upon (for example) an experience analysis covering the period up to 2019, you should be careful to consider what the knock-on impact of changing your longevity assumptions to a post-COVID projection will be.
What do you think?
Is it a surprise that post-pandemic data influences pre-pandemic estimates of trends? Will this affect your baseline mortality modelling? What do you think about the proposed increase in weight on post-pandemic data in the next version of the CMI Mortality Projections model?