Question:
At retirement (aged 65) you are given the chance to enter a prize competition with a group of people (all the same age as you).
The last survivor in your group will win a grand prize: 5 gold rings and an extensive aviary of well-cared-for and appropriately housed festive birds.
You have a choice of five different (independent) groups you could join:
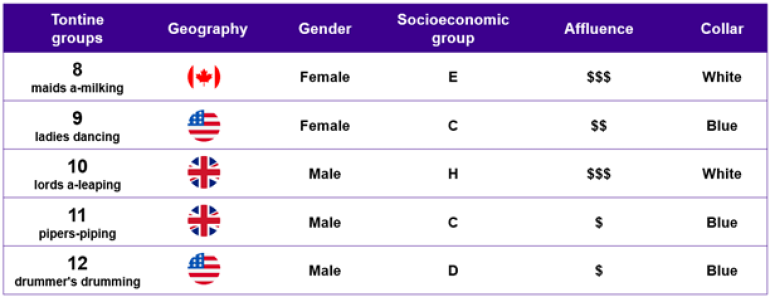
- Eight female dairy industry executives from Quebec.
- Nine retiring members of the Rockettes dance troupe from New York City.
- Ten male unelected politicians from the Westminster area of London.
- Eleven male traditional Scottish musicians from Inverness.
- Twelve retiring male percussionists from Nashville.


Answer:
If everyone in each group experiences the same mortality rates, then the answer is easy: it will be whichever group has the fewest members. Even if everyone in a group experiences the same mortality rates, random noise means they are unlikely to all die at the exact same time. The larger the group, the greater the likelihood of one person outliving expectations, and the longer we would expect at least one of them to survive. This seems to have been a common thought process when responding to our LinkedIn poll, with 42% picking the group with the fewest members.
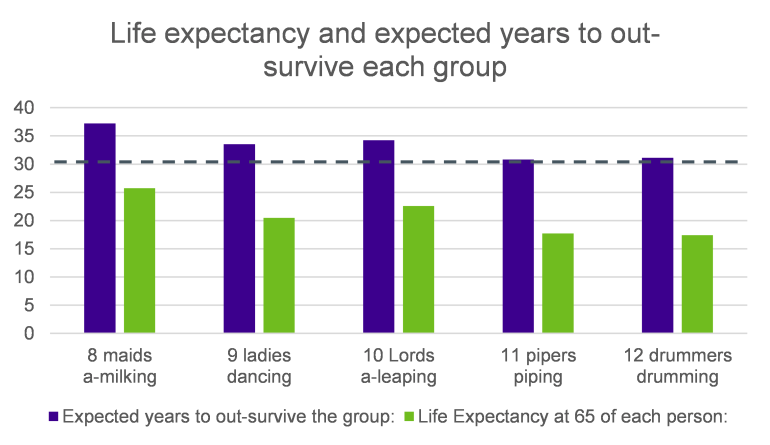
If each group has the same number of people in it, then the answer would also be straightforward: it would be whichever group contains the people with the shortest life expectancy. The groups in the question have various indicators of how long they might live including sex, geography, lifestyle and affluence. If each group was expected to have the same variation, we’d just need to know which individuals were expected to live the shortest lives. According to our calculations the drummers had the shortest life expectancy, although only 16% of our poll responses picked this group.
So, the question becomes whether longer expected lives of the members of the smaller groups counter-act the variability in survival outcomes, seen in larger groups. The chart below shows the results of our modeling. Despite not being the smallest group, or the group with the shortest individual life expectancy, you have the best chance of winning the prize if you join the group with 11 pipers piping. Well done to the 19% of respondents who picked this group.
Notes:
The VitaCurves we used for each group is as follows:
- Maids a-milking CV22v1_1820_FPNalgEpb3ocO;
- ladies dancing CV22_USv2_1820_FPNalgC9pb2ocB;
- Lords a-leaping CV22v2_1820_MPNalgHpb5ocO;
- pipers piping CV22v2_1820_MPNalgCpb2ocM;
- drummers drumming CV22_USv2_1820_MPNalgD9pb3ocB
For simplicity, all modeling is based on period life expectancy with no allowance for future improvements, we’ve assumed all the lives are independent and that the number of surviving people is a continuous variable.