


Question:
Were 2024 mortality rates in the England & Wales similar to the low levels seen in 2019?
Answer:
Yes, and no…
Looking at the headline Age-Standardised Mortality Rates1 , we might conclude that mortality rates are very similar to those in 20192 . This is good news – 2019 saw the lowest mortality rates on record. This result would seem to indicate that the COVID pandemic is now firmly in the rear-view mirror.
However, if we examine the numbers for different age groups, we see that 2024 mortality rates are quite different to those for 2019. The chart below shows the changes in mortality rates for different age groups from 2019 to 2024.


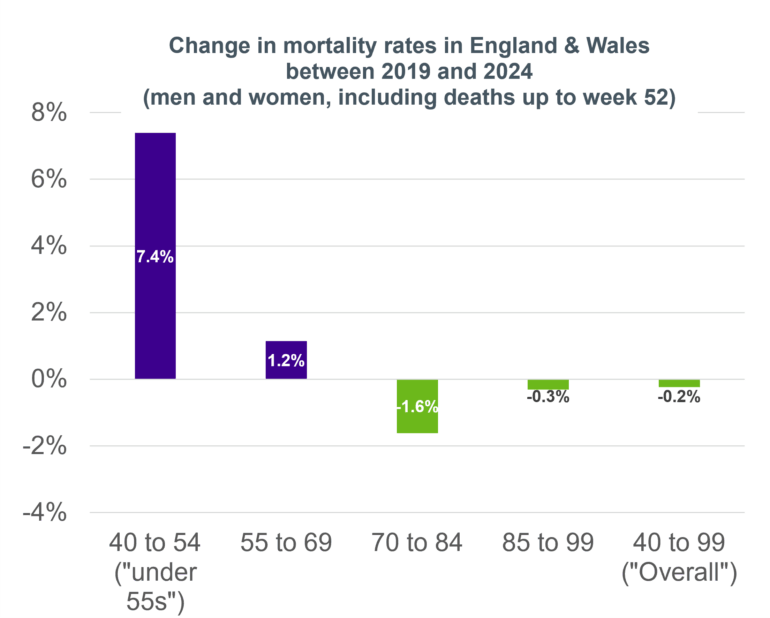
Source: Club Vita calculations based on aggregated data from the CMI Mortality Monitor software 2024 v5, updated to include data up to the end of week 52 2024. With thanks to the CMI for maintaining this excellent resource.
Key takeaways
- For those below age 55, mortality rates have increased by a remarkable 7.4% since 2019.
- In contrast, mortality rates for 70- to 84-year-olds have reduced by 1.6%.
- There are far fewer deaths amongst under 55s, so these divergent trends largely cancel out in the headline results (captured by our “Overall” figure).
- Amongst 70- to 84-year-olds, we see mortality rates continue to reduce in the post-COVID era. But something very different and worrying seems to be happening amongst under 55s.
What is going on amongst under 55s?
If we look at pre-COVID trends, we see a similar feature; reductions in mortality rates were lower amongst under 55s in the period 2011 to 2019 than amongst older lives, albeit mortality rates were still reducing3 . However, when we compare 2019 to 2024 we see mortality rates amongst under 55s starting to increase.
The exact reasons for this slowdown and now reversal need further investigation but may relate to worsening lifestyles and diets and associated increases in obesity and lifestyle diseases like diabetes.
What does this mean for future improvements?
Actuaries working in longevity risk care most about mortality rates in the 70+ age range4 . Whilst mortality rates have increased somewhat amongst under 55s, most people will nevertheless survive to retirement.
The key questions are:
- What do these negative mortality improvements mean for current under 55s once they reach retirement?
- Should we expect current under 55s to see significantly lower improvements throughout their life course? (Such a trend is often referred to as a cohort effect.)
- Or are heavier mortality rates a specific emerging feature for under 55s both now and in the future, with limited implications for the specific future life course of this generation? (Often referred to as an age effect.)
- And how has the increase in mortality rates amongst under 55s been seen across the socioeconomic spectrum? If this trend had a greater impact on lower socioeconomic groups, it may not be appropriate to apply a resulting cohort effect to more affluent populations, such as those making up defined benefit pension scheme or insurer liabilities. This would essentially be taking advanced “credit” for a projected slowdown in mortality improvements that may never materialise for the relevant population.
How to interpret and project these differential trends is a topic of active discussion, and we are aware that the CMI Mortality Projections Committee are wrestling with this problem as part of producing the CMI_2024 model. A consultation will be carried out on their proposed approach in the second half of February, with the final model due to be published by the end of June.
1 Actuaries and demographers often use Age Standardised Mortality Rates (“ASMRs”) to compare mortality rates in different years or across different populations. These rates control for differences in the age mix of the two populations, which provides a fairer comparison between years. In this note we have measured changes in ASMRs.
2 We actually see a slight reduction in overall mortality rates from 2019 to 2024, However, 2024 mortality rates could be somewhat understated due to death certification reforms. The CMI estimate that they could be understated by 0.25%. Controlling for this would broadly cancel out the headline reduction in mortality since 2019.
3 On a consistent basis, improvements were 0.2% p.a. amongst under 55s but 1.0% p.a. amongst 70- to 84-year-olds during 2011-2019.