


Question:
We are now over half-way through the year. How did the first half of 2026 compare with previous years in England & Wales, and what does this tell us about emerging longevity trends?
Answer:
Based on the first half of the year, 2026 is shaping up to be a very light year for mortality in England & Wales.
In the chart below, we compare weekly registered1 mortality rates amongst the pensioner age population in England & Wales during 2026 with 2019 (the last year prior to the COVID pandemic) and 2025.


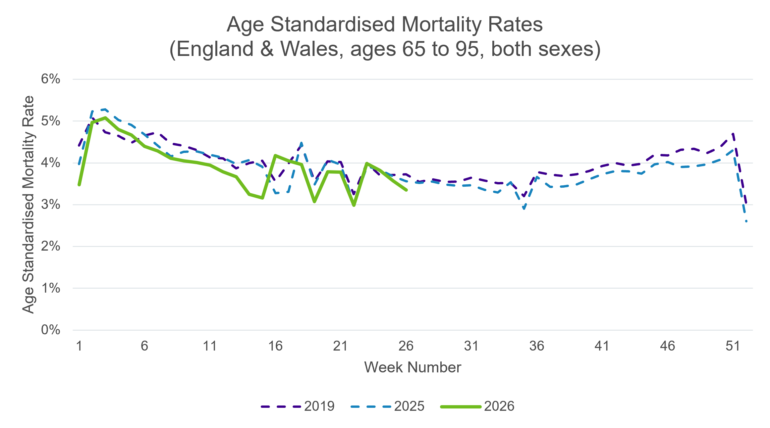
Club Vita calculations using the CMI’s Mortality Monitor Software, based on ONS data published on 8 July 2026.
We see that during the first half of 2026 mortality rates have been significantly lower than during either 2025 or 2019. In aggregate, 2026 to date has been approximately 4.5% lighter than 2025.
Even if mortality rates in the latter half of 2026 are in line with the latter half of 2025, this would lead to a headline improvement in mortality rates for 65–to-95-year-olds of around 2.25%.
What would this mean for the CMI Model?
If we assume that in aggregate, mortality rates in 2026 are 2.25% lighter than in 2025, this leads to a strengthening of the projection compared with core CMI_2025, bringing it broadly in line with a projection based purely on 2019 data.
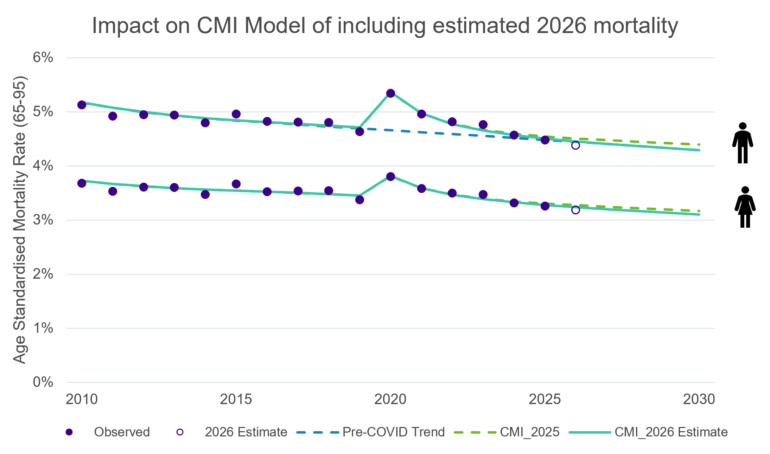
Pre-COVID trend based on CMI_2025 calibrated to 1979-2019 data with Fitted Overlay turned off. CMI_2025 based on core model. CMI_2026 based on a core run calibrated to 1986 to 2026 data with mortality rates assumed to be 2.25% lighter at all ages during 2026. In each case, the long-term rate is 1.5% p.a
This would lead to an increase in liabilities for a typical DB pension plan of approximately 1%.
If we also see material improvements in mortality during the latter half of 2026 relative to the same period in 2025, this would lead to a core CMI_2026 model which gives higher improvements during the latter part of this decade than a model based purely on pre-COVID data.
Key takeaways:
As we emerge from the pandemic, each added year of data is crucial to both how the CMI model processes the data and how we interpret the resulting projections.
Is the light mortality seen during the first half of 2026 indicative of further strong improvements for the remainder of the decade, or is it a short-term survivorship effect following the pandemic?
1 When measuring recent trends in mortality we generally rely on deaths registered rather than deaths occurred. This is because of reporting delays – it will take a year or more for all deaths occurring in a particular week to be registered due to post-mortems or full inquests.