


When looking at death statistics, it is useful to consider whether there have been more, or fewer, deaths than ‘expected’ over the period in question. In order to explore this, you first need to set your expectations, to give a frame of reference.

The ONS, when publishing death counts for England & Wales (E&W), has long used a rolling 5 year average to determine the expected deaths, and so the level of excess (which could be negative). While undeniably straightforward and transparent, this approach does have a number of potential down sides:
- It makes no allowance for changes in the population over time.
- For example, the E&W population has both increased (so there are more people) and aged over time (the average age has been increasing, as people live longer and birth rates fall), both of which would be expected to increase the count of deaths.
- It can be impacted by timing quirks in particular years.
- For example, when considering weekly death registrations, the precise timing of public holidays can skew comparisons of death counts between different years.
- There is no allowance for trends in mortality rates (e.g. the fairly steady fall in annual mortality rates seen up to 2011).
And of course the COVID-19 pandemic exacerbated the issues with using a simplistic 5 year rolling average as a comparison – given the extreme mortality seen in 2020 and early 2021, even applying 1/5th weighting to these years would have resulted in artificially high ‘expected’ mortality to use in subsequent years).
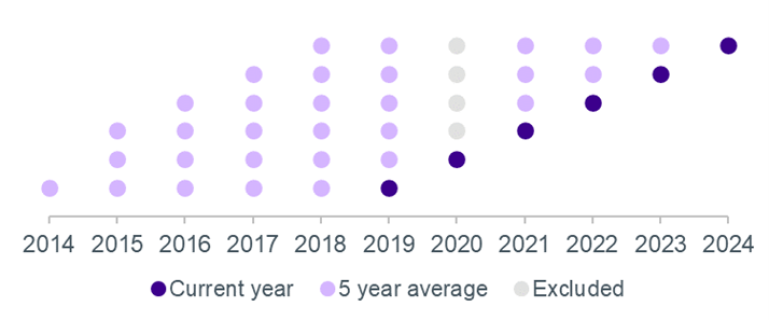
The ONS have until now skirted round the 2020 issue by comparing to the 2015-19 average for both 2020 and 2021, then ‘missing out’ 2020 for later years, as shown in the chart (for each dark purple dot representing a year from 2019 to 2024, the light purple dots in the same horizontal line show the 5-year average that has been used as a comparator for assessing excess deaths).
However, in collaboration with statistical agencies across the UK, the ONS have now implemented a revised approach to determining expected, and so excess, deaths.
The new approach
So what has changed? Essentially1 they’ve moved away from looking purely at historical death counts, and instead derive expected age-specific mortality rates and associated population estimates. This approach avoids many of the pitfalls of the old approach, as it will automatically allow for population changes, and has been designed to also reflect trends over time, as well as seasonality. While the impacts of COVID-19 are still removed from the calculations, this is done at a more granular level than the old approach of ignoring 2020 entirely (so weekly excess deaths ignore specific weeks over 2020/21, and monthly excess deaths ignore specific months).
What difference does it make?
The following chart compares the total UK excess deaths for each calendar year (based on summing the calculated monthly excess deaths):
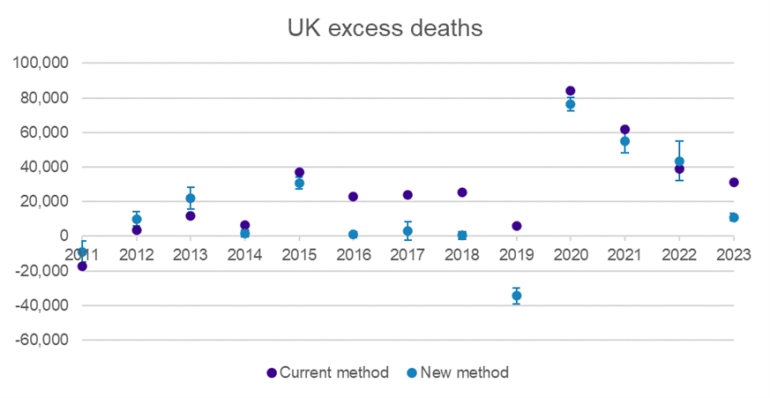
The new method gives lower excess deaths each year, with the exception of 2022. This is driven by the increasing population and increasing average age, which are allowed for in the new method (and so will give higher expected deaths and so lower excess deaths).
This effect is partially offset by the slowdown in improvements in mortality rates seen in the early 2010s, as the new method assumes some continuation of the previous rate of improvement, which did not occur in reality, and so actual deaths will be higher than predicted by the trend.
The sharp fall in population mortality seen in 2019 results in much lower excess deaths under the new method (as improvements in that year were much higher than suggested by the previous, fairly flat, trend).
The excess deaths are fairly similar under both methods for 2020 to 2022, while 2023 sees a return to lower excess figures under the new approach.
While excess death figures can give interesting headlines, particularly following the pandemic, it is important to recognise that they, by definition, are estimates that require a number of assumptions around expected death levels. While the new methodology is arguably less transparent, it is statistically a ‘better’ measure for representing excess deaths, as it allows for population changes and observed trends over time.
1 For all the technical detail around the new methodology, see the ONS’s analysis: https://www.ons.gov.uk/peoplepopulationandcommunity/healthandsocialcare/causesofdeath/articles/estimatingexcessdeathsintheukmethodologychanges/february2024