


Question:
Is life expectancy the same for public sector pension plans across the US?
Answer:
The answer is a resounding no! At least, according to the actuarial assumptions identified in a recent survey by the National Association of State Retirement Administrators (NASRA).

In August of 2024, NASRA released a survey outlining the mortality assumptions used by many of the largest Public Pension Systems across the United States. Club Vita has completed a comprehensive review of these assumptions, calculating life expectancies for all the different plans and comparing the results across industries and geographies. The final report details 157 distinct mortality assumptions across 148 Public Plans and Systems. You can download the full report here.
As expected, we see distinctly different assumptions between Teachers, Public Safety and General1 public sector plans. But there are also wide ranges of life expectancies between plans within these groups, and the differences are being driven by factors other than geographical location. The chart below shows the range of life expectancies generated by the surveyed assumptions for public sector general plans.
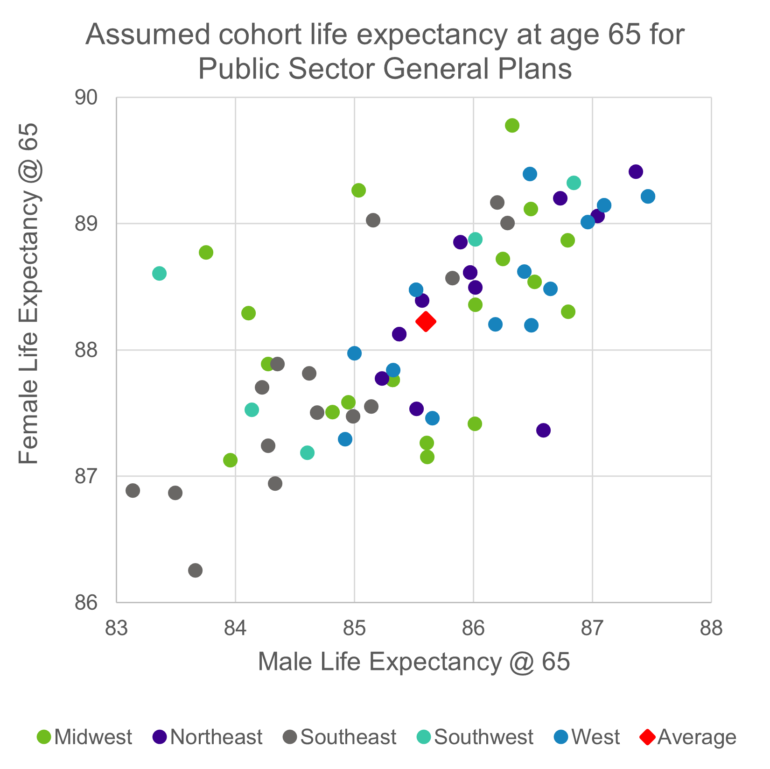
Source: Club Vita modeled cohort life expectancy using NASRA 2024 Assumption Survey; Assumptions use plan-specific base mortality and improvement scales.; Date of Calculation: Jan 1, 2024
Key takeaways:
- There is a wide range of different life expectancy assumptions being used by US public sector general pension plans - nearly five years of difference for men and four years for women
- The differences are not driven by geographical location. Within each of the Nat-Geo US regions, Midwest, Northeast, Southeast, Southwest and West, there is also a wide spread of life expectancy assumptions.
- The majority of these plans use assumptions that reflect recent mortality experience within the plan’s own data. So, there must be longevity characteristics of their participants that are having a larger effect on their mortality experience than geographical location.
The key questions are:
- What is driving the differences in life expectancy assumptions between different plans?
- Will differences in historical plan experience continue into the future?
If you are a public sector plan grappling with these questions, Club Vita’s mortality segmentation by factors such as ZIP code, affluence, benefit type and occupation may help you understand the underlying drivers of your mortality experience. If you’d like to discuss this and what it might mean for future assumptions (or anything else), please don’t hesitate to get in touch.