Questions:
- How did mortality during 2022 compare with 2020 and 2021 and with pre-COVID trends?
- How can 2022 mortality data help us set a post-COVID longevity projection?
Excess mortality during 2022
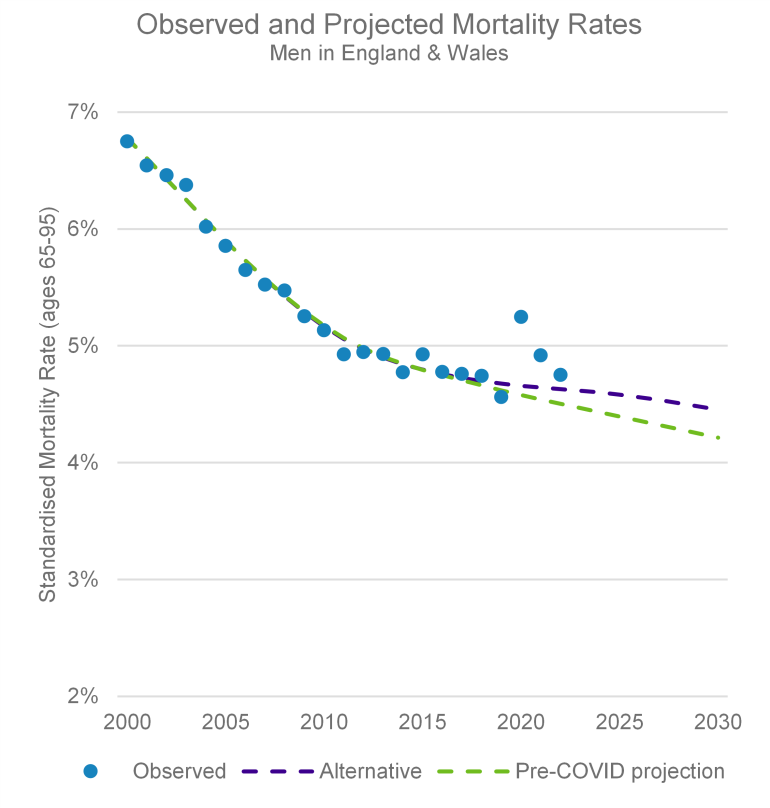
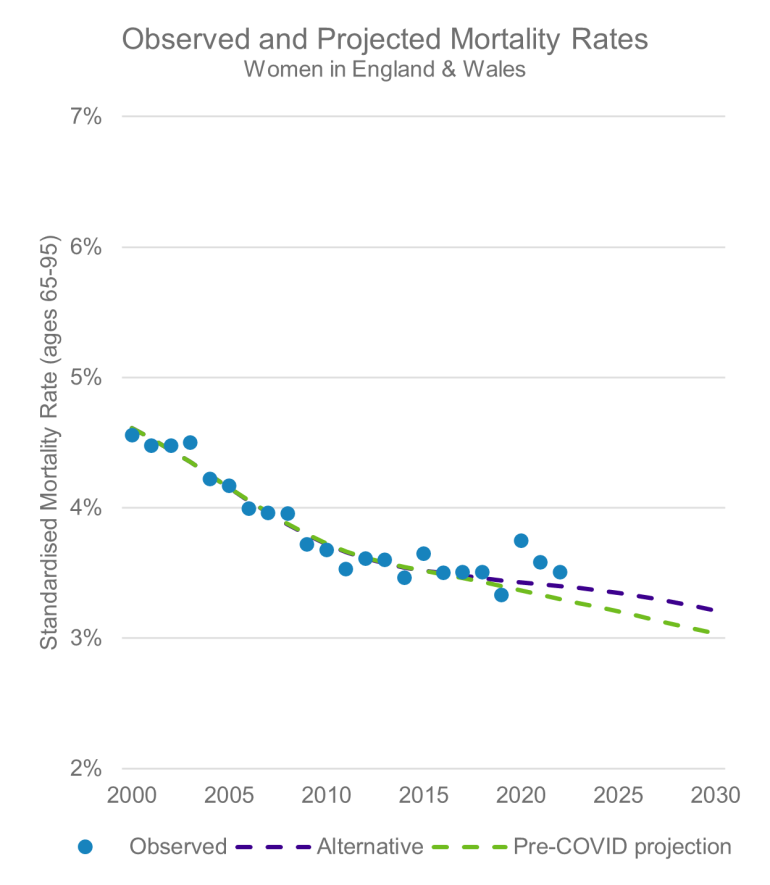
Mortality rates in 2022, whilst lower than in 2020 and 2021, were significantly higher than what we might have expected based on pre-COVID trends. We estimate that during 2022, mortality was around 6% higher for both men and women than that expected pre-COVID. We now must ask ourselves to what extent this higher than expected mortality will persist. This question is central to a recent consultation released by the CMI and is something we discussed in detail in our webinar: What happened in 2022?
Watch our webinar recording from 9th February 2023 for a deep dive discussion on
What happened in 2022? The UK excess mortality conundrum, what caused it and will it continue?
The charts below show age standardised mortality rates (SMRs) seen in England and Wales in each calendar year from 2000 to 2022. The green line shows a typical projection of mortality rates based on pre-pandemic trends. The purple line shows an alternative post-2019 trend where we “bake-in” 50% of the difference between observed and expected mortality for 2022.


Notes & sources: SMRs for years 2000 to 2021 calculated using data contained in CMI_2021 model and standardised using the widely used European Standard Population. SMRs for 2022 estimated based on ONS weekly death data for 2022. The pre-COVID projection shows the core projection of CMI_2021 with a long-term rate of 1.5% pa. The alternative projection adjusts the post-2019 trend to allow for an illustrative 50% of the difference between observed and expected mortality for 2022.
Key takeaways
- In England & Wales, 2022 was another year of high levels of excess mortality. We estimate mortality rates were around 6% higher than pre-COVID expectations.
- When assessing how longevity trends are likely to emerge in the coming years, a useful approach is to
- Assess what are the key drivers of the excess mortality seen in 2022
- Consider whether these drivers are likely to be shorter or longer lived
- Drivers of longevity trends have different impacts on different socioeconomic groups. We look forward to sharing insights on emerging trends in the Club Vita dataset in the coming months.
What conclusions can we draw from the 2022 data?
The key question we need to ask is to what extent excess mortality in 2022 was driven by short-lived phenomena and to what extent it is indicative of the “new normal” post COVID. To answer this, we need to consider why mortality rates in 2022 were so much higher than our pre-COVID prediction. Some factors to consider are:
- Direct COVID deaths – how many deaths in 2022 were as a direct result of COVID infections?
- Indirect COVID deaths – how many deaths in 2022 were due to the knock-on effects of a COVID infection?
- Pressures on the NHS – how many deaths might have been prevented if the NHS wasn’t suffering from capacity constraints and backlogs caused by the pandemic?
- Other factors – for example, heat waves, the cost-of-living crisis and the increased prevalence of circulatory diseases post-lockdown.
For each of these factors, we can consider to what extent we would expect them to persist into the short-to-medium term. For example, we might expect direct COVID deaths to continue to reduce during 2023 and beyond, whereas pressures on the NHS may take longer to resolve.
What is certainly true is that the world is a different place since COVID-19 and everything else that has happened since the start of 2020. It would therefore seem reasonable that expectations for mortality rates in 2023 and beyond should be higher than what we might have predicted based on data up to 2019.
Relevance of population data
We often use population data as a starting point when thinking about longevity trends. It is a very large dataset, which enables the complexity of modelling incorporated in the CMI model. The Office of National Statistics does a great job of publishing mortality data promptly, enabling rapid insights to be drawn on emerging trends.
However, different sections of society are impacted differently by the drivers of emerging longevity trends. We look forward to probing the Club Vita dataset in the coming months for insights on what mortality in 2022 looked like for different types of pension scheme members and sharing these insights with our community of subscribers and supporters.


