


When not spending my time overseeing the latest VitaCurves calibrations, or coaching 8-year-old footballers, I often find myself thinking about the future of longevity. Will it start increasing again, or will it continue to stutter under the burden of the COVID-19 pandemic? I therefore read the latest proposals from the CMI on how they propose to update their projection model with interest.

I would suggest that any model for projecting future mortality rates, and so longevity, would ideally meet four key requirements:
- A sensible fit to observed mortality rates pre COVID;
- A sensible fit to observed mortality rates post COVID;
- A plausible launching off point for best estimate improvements; and
- Robustness over time as new data emerges.
The CMI (or Continuous Mortality Investigation) publish their own mortality projections model, which has become the industry standard in the UK. Prior to the COVID-19 pandemic, the CMI’s projections model performed well against all these criteria. However, the addition of pandemic era data has left the model struggling to meet these requirements.
New year, new model edition
The CMI’s model fits smoothed improvements to historical data to estimate the current underlying rate of improvement seen in the population. This current rate is then projected into the future to the (user specified) long term rate of improvement. The smoothed improvements are fitted over a rolling 41-year period, applied to England & Wales population data. There has been much discussion recently around the extent to which post pandemic experience should be allowed for in fitting the model. Previous versions of the model placed no weight on 2020 or 2021 experience. However last year’s version (‘CMI_2022’), while still excluding 2020 and 2021, made partial allowance for 2022 data, giving it a 25% weight (with all years prior to 2020 given 100% weight).
The CMI recently carried out a consultation on their proposals for the next version of their mortality projections model (‘CMI_2023’), which is due to be published next month1. This model will include England & Wales population data for 2023 for the first time, alongside updates to data for previous years following on from the 2021 census. The consultation primarily focused on the CMI’s proposal for their ‘core’ parameterisation, and, in particular, the weights to give to 2022 and 2023 data in fitting improvements to historical data.
At the time of publication of CMI_2022, the steer given by the CMI was that they expected to gradually return to a 100% weighting over 4 years (i.e. 25% weight to 2022 experience, 50% for 2023, 75% for 2024 and 100% for 2025), although with the caveat that this was subject to change. However the proposal for CMI_2023 adopts a different approach – a single weighting of just 10%, applied to both 2022 and 2023.
Does the model meet my desirable characteristics?
Has this single, lower, weighting to both 2022 and 2023’s experience helped the model meet my desirable characteristics?
We can explore this question by looking at standardised mortality rates (which remove variations in age profiles over time and condense mortality rates into a single figure for ease of comparison). The chart shows the observed standardised mortality rates for men (purple dots) and how the proposed core settings for the CMI_2023 model (using an illustrative long-term rate of 1.5% p.a.) would smooth through those rates (blue line).
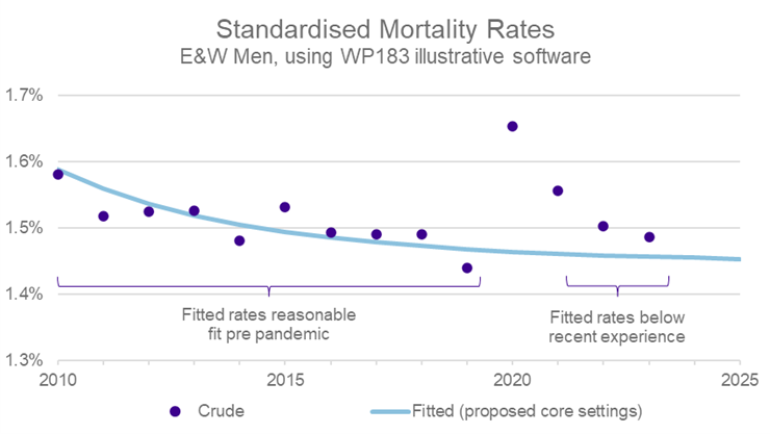
While a reasonable fit to pre 2020 experience, the fitted line falls below the 2023 value, due to the low weights given to 2022 and 2023.
In our response to the consultation, we therefore suggested the CMI schedule a more wholesale parameter and/or structure review to explore alternative approaches in pursuit of achieving the desirable characteristics.
What else did we say in our consultation response
We also addressed two other questions in our consultation response.
1 How will end users of CMI projections view the approach taken?
The ONS’s change in methodology for measuring excess mortality2, and the resulting lower levels of excess mortality reported for 2023, have been widely commented on in the media in recent weeks. This means that an approach which places just 10% weight on 2023 data is likely to be viewed with scepticism by end users of the projection, regardless of the technical justification.
More generally, the change in approach from CMI_2022 leads to several wider communication challenges, for example:
- Does applying lower weights than signposted last year suggest the information provided by 2022 and 2023 data is viewed by the CMI as less informative than last year?
- A 10% weighting seems very low and might be perceived as spurious / immaterial by users3.
- An equal weighting to both 2022 and 2023 suggests a view that both are ‘equally informative’ of post COVID trends. This seems somewhat contrary to the general feeling that 2023 had reverted closer to ‘business as usual’ post pandemic.
2 What are the practical challenges when using the proposed model?
We appreciate that a wholesale review of the model by the CMI may not be practical at this time, and so the published version of CMI_2023 will likely follow the form suggested in the consultation. However, we encouraged the CMI to resolve some practical challenges in the model as proposed, including:
- Different users have approached allowance for the COVID-19 pandemic in different ways. For example some users have tracked population experience over recent years and so are ‘launching off’ from a base table that already embeds endemic COVID. There is a material risk that for these users the proposed core model provides for too low a launching off point for improvements, as it risks ‘double counting’ the impact of the pandemic by both increasing base mortality and reducing short-term improvements.
- The ease of producing projections with weightings which differ for 2022 and 2023, as the use of a single weighting applying to both years is embedded in both the ‘Core’ and ‘Extended’ parameterisation, as well as within the bulk run facility contained in the model.
What next?
The consultation on the proposals for CMI_2023 closed on 11th March 2024. The CMI intends to provide an update on any changes of approach as a result of the consultation by the end of March, ahead of the final model being published in April.
Whilst we provided constructive feedback to the CMI consultation, we also thank the CMI for their work in providing the proposed model, and accompanying information, particularly given the unprecedented events of the past few years.
We anticipate that the debate as to how to calibrate projections, and how the CMI model can usefully evolve to continue to meet users needs will rumble on for some time yet….
1 In recent years, the year the model is named after corresponds to the latest year of data used in the calibration.
2 https://www.clubvita.net/uk/news-and-insights/what-did-you-expect
3 However it is worth noting the non-linearity of the impact of the weighting factor, as discussed last year, when a 25% weight for 2022 resulted in an impact around halfway between applying 0% and 100% weights. https://www.clubvita.net/uk/news-and-insights/top-charts-23-08-incorporating-pandemic-data-into-mortality-projection-models