


In our final blog covering the recent release of the 2024 Canadian Pensioner Mortality Research (CPM2024) Project, we focus on considerations for practitioners conducting experience studies to set plan specific mortality assumptions.
What is an experience study?
The overall aim in setting baseline mortality assumptions is to incorporate as much relevant information as possible about a population to derive a representative estimate of current mortality rates for that group. Best practice generally follows a two-step process:
- Selection of a “prior” assumption: Select an initial assumption for current mortality rates (a base table) that gets as close as possible to the underlying mortality characteristics of your population.
- Fine tune the prior assumption using plan-specific experience: Refine the prior assumption using plan-specific experience data to capture any residual mortality characteristics not explained by the prior baseline model.


We covered step 1 in more detail in the second blog on longevity risk factors. An experience study constitutes a simple framework for step 2: it compares a plan’s observed (“Actual”) mortality to that predicted by the prior assumption from step 1 (“Expected”) and uses that comparison to assess whether any adjustments are appropriate to the prior assumption.
The closer we can get to the underlying mortality experience in step 1, the smaller the residual adjustments will need to be in step 2, reducing any imprecisions that may be introduced in the adjustment process (for example distortions of age shape if applying the same adjustments across all ages, or from over-fitting experience from small subsets of data).
Before making any adjustments, we must make sure any differences identified between a plan’s experience data and the prior model are based on reliable data and are expected to persist in the future for the current pension plan’s population. If the experience is considered representative of future mortality and is notably different from the prior model’s predictions, then we would typically apply a credibility weighted adjustment when setting the future mortality assumption.
Aligning CPM2024 to historical experience
The prior mortality assumption from step 1 above is a set of mortality rates identified at a specific date, known as the “effective date”. Experience studies compare actual mortality experience observed in historical years to those predicted by the prior assumption. In order to compare like with like, the mortality rates in the prior assumption must therefore be adjusted to allow for the difference between the effective date and the period of observed experience being analyzed using a mortality improvement scale.
CPM2024 has an effective date of January 1, 2024. If, for example, we are comparing CPM2024 to a plan’s experience over 2015 to 2019, the 2024 rates in the assumption need to be rolled back to that earlier period to ensure a consistent comparison.
Following the release of the CPM2024 tables, the CIA published a supplemental guidance document to support practitioners applying them in experience studies. This includes one dimensional historical mortality improvement scale (CPM2024 H1D), which is the average mortality trend embedded in the CPM2024 model after removing pandemic effects. It is intended to adjust CPM2024 rates backward from the effective date of 2024 to the period of observed experience, reflecting the pensioner mortality trends and the framework used to construct the tables. It is expected that practitioners will use these tables only for experience studies and not future mortality projection. For those using CPM2024 H1D, it would mean having a table for experience analysis to determine plan-specific baseline assumption, and another for future projections (e.g., CIA-MI-2024).
Considerations when conducting an experience study with CPM2024 tables
Experience studies are inherently backward looking; analyzing historical experience data and translating that analysis into forward looking assumptions introduces a degree of judgement. We will cover three situations where this judgement becomes particularly important:
- Setting a prior assumption
- How to handle experience influenced by the COVID 19 pandemic
- Credibility adjustments
Setting a prior assumption
As discussed earlier, the closer we can get to the underlying mortality experience with our prior assumption, the smaller the residual adjustments will need to be from an experience analysis and the lower the imprecisions introduced in the adjustment process. As part of the experience study, we must therefore try to pick a prior assumption that represents the plan’s mortality as closely as possible.
In our second blog on longevity risk factors, we discussed how multi-factor models can use a plan’s characteristics to capture its underlying mortality. Where more advanced approaches such as these cannot be used and CPM2024 is relied upon as the prior assumption, practitioners need to select the most appropriate table from the “Heavy,” “Combined,” or “Light” categories.
The charts below shows a comparison of year-on-year ratios of actual to expected death amounts (“A/E ratio”): for a specific pension plan over the period 2015 to 2022. The left-hand chart uses the Combined tables as the expected (prior) assumption, the right-hand chart uses the Heavy tables as the expected (prior) assumption.
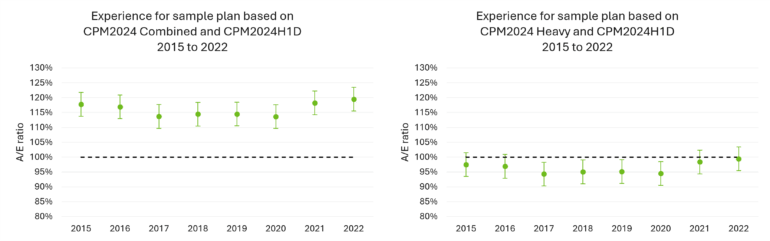
We note that it is often better to look at the non-COVID period in a year-on-year analysis when assessing the prior assumption to avoid possible pandemic related distortions. In this example the Heavy tables provide a better prior assumption than the Combined tables.
How to handle COVID years of experience
In the third blog in this series, we discussed how the Canadian population experienced elevated mortality from 2020 through 2022, peaking in 2022, with some evidence that elevated levels persisted into 2023 and 2024. We also noted that defined benefit (DB) pensioners generally experienced lower excess mortality than the general population and that different geographical areas in Canada experienced different levels of excess mortality during the pandemic.
When assessing a specific pension plan’s experience, elevated mortality from the COVID years can distort results. In an experience study, we are trying to capture a persistent mortality effect that is different to the prior assumption. Adjusting the prior assumption to reflect elevated mortality observed in the pandemic will not be appropriate, unless there is a clear expectation that these conditions will persist.
The CIA guidance reinforces this point and states the need to assess pandemic experience separately and to avoid applying adjustments mechanically without considering the specific circumstances of the plan.
The CPM2024 tables are calibrated such that mortality rates in 2024 do not reflect elevated COVID mortality. If paired with a trend assumption which also excludes COVID effects (such as CPM2024 H1D or the available two-dimensional Canadian improvement scales), the resulting expected mortality will similarly not reflect COVID mortality.
For experience studies covering data up to 2019, this is not as issue. However, for studies that include post 2019 experience, additional judgement is required to set a plan-specific assumption from an experience study. This may involve excluding pandemic years altogether, or making explicit adjustments to reflect the higher mortality observed during that period.
To illustrate this, we extended our A/E analysis to compare actual to expected death amounts under two models:
- CPM2024 Heavy tables with CPM2024 H1D (chart on the left below)
- Club Vita’s VitaCurves with the MI‑2017 improvement scale (chart on the right below)
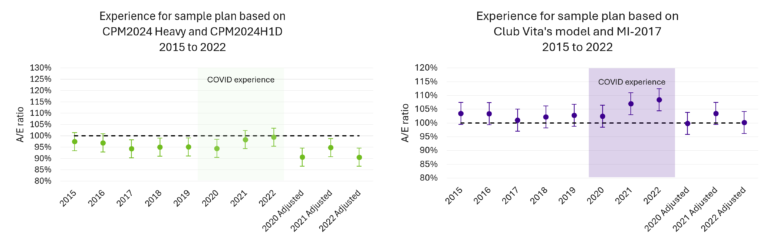
In both cases, we see an increase in mortality in the pandemic years, particularly 2021 and 2022, which is similar to progression of mortality at the population level.
Approach 1: Excluding COVID years
One approach is to exclude pandemic years and base assumptions on pre pandemic experience (in this example, this would be 2015 to 2019). This would have the benefit of avoiding the introduction of pandemic distortions into the analysis but the trade off is that more recent experience is ignored. Over time, this may mean supplementing earlier data with post pandemic years (such as 2023 onwards), once there is greater clarity on whether mortality has stabilized post-pandemic. While population data suggests some continued excess mortality in 2023 and 2024, plan specific experience may differ, requiring practitioners to assess and exercise judgement on a case‑by‑case basis.
Approach 2: Adjusting for COVID experience
The next option is to retain the full experience period and adjust for elevated COVID mortality. This approach benefits from incorporating more recent data, while recognizing that observed mortality during the pandemic may not reflect underlying expectations of baseline mortality for the plan.
In the example, we have also shown “adjusted” A/E figures for 2020, 2021 and 2022 where we have made adjustments to expected deaths to reflect a higher level of mortality expected through the pandemic years.
When making such adjustments, there are many considerations for estimating the expected elevated mortality through the pandemic period. These include general population levels of excess mortality for specific years, geographical differences in excess mortality, and differences between excess mortality in the general population and DB pensioners. The table below shows some examples of these differences for males.
Male excess mortality (ages 60-95)1,2,3 | 2020 | 2021 | 2022 |
Club Vita | 102.6% | 103.4% | 108.3% |
Canada Population | 105.0% | 104.3% | 111.7% |
Ontario Population | 104.3% | 103.8% | 109.8% |
British Columbia Population | 104.3% | 107.7% | 111.2% |
Quebec Population | 109.2% | 101.1% | 113.0% |
Note: The population excess mortality figures shown above are based on expected deaths in each year estimated using age-specific mortality rates from Statistics Canada's 2017/2019 life tables. The mortality rates were projected forward using the MI-2017 improvement scale and then applied to annual population exposures to calculate expected deaths.
After adjusting the expected deaths for pandemic years to reflect higher levels of expected mortality, the resulting A/E analysis can provide some insight into residual differences between a specific pension plan and the prior assumption. However, the additional uncertainty introduced by these adjustments means that greater judgement is required when interpreting the results and considering any changes to the prior assumption.
Credibility adjustments
Regardless of how you selected your prior assumption or allowed for COVID, if the resulting analysis shows that actual deaths are notably different from the expected deaths under the prior assumption, it may be appropriate to adjust the mortality rates in the prior assumption to reflect these differences.
Credibility analysis is a formal process used to determine how much weight to assign to a group’s observed experience when developing or adjusting assumptions. The goal is to balance mortality levels in plan-specific experience data with broader industry-based mortality assumptions in a statistically sound way. This helps ensure that any adjustments made to the prior mortality assumption reflect statistically credible differences, rather than random variation due to limited data.
The common credibility methodologies (most notably the Limited Fluctuation or Greatest Accuracy approaches) assign a weighting to the experience data based on things like size and volatility of the experience data and the data set underlying the prior assumption. It is important to remember that an underlying assumption of credibility analysis is that the experience data analyzed is complete, reasonable and relevant and representative of the mortality of the current group of living individuals in the plan.
If introducing extra uncertainty into the analysis, such as adjustments for COVID experience or changing demographics of an underlying population, it may be appropriate to introduce greater margins for uncertainty into the credibility assigned to experience data. Actuaries will need to exercise judgement in this area.
What do you think?
The release of the CPM2024 tables means that many pension plans are now refreshing their mortality assumptions. At the same time, a number of factors are making today’s experience studies more challenging.
- CPM2024 tables and the complimentary improvement scale do not reflect COVID mortality. As a result, setting assumptions now requires careful interpretation of pandemic experience, as using unadjusted experience implicitly assumes that elevated mortality will continue into the future.
- Practitioners need to make a choice in how COVID experience is treated. This could be through excluding COVID years or an adjusting expected mortality.
- COVID experience has varied across Canada and by plan. One‑size‑fits‑all adjustment is unlikely to be appropriate. In our experience at Club Vita, allowing for variation by gender, age, and province, as well as recognizing that DB pensioners were insulated during the pandemic has proven to be a reasonable approach.
- Table selection itself is more complex in the presence of COVID experience. In addition to handling COVID mortality, plans will have to determine the table that best suits their experience, COVID experience can distort this analysis. It will be essential to review pre‑pandemic experience and, where available, post‑pandemic data.
- Small plans require a different lens. Smaller plans have limited and often volatile experience, therefore cannot rely on experience studies alone to set assumptions.
- Understanding the drivers of mortality is important. Experience studies highlight where plans differ, but not always why. Approaches such as factor-based models that explicitly incorporate longevity risk factors provide a more objective basis for setting assumptions, particularly when plans do not align neatly with standard tables.
Lastly, we’d love to hear from you. Please contact us with any questions or topics you want us to cover.
1Statistics Canada. Table 13-10-0114-01 Life expectancy and other elements of the complete life table, three-year estimates, Canada, all provinces except Prince Edward Island
2Human Mortality Database (HMD). Max Planck Institute for Demographic Research (Germany), University of California, Berkeley (USA), and French Institute for Demographic Studies (France). Available at mortality.org (data downloaded on September 10, 2025)
3Age standardization completed using the 2021 Canadian census population structure.