


The Continuous Mortality Investigation (CMI) have proposed some significant changes to the upcoming CMI_2024 model. In our second blog of a series, we discuss another of these changes: the proposed introduction of “Multiple Period Terms” to the model.

It is notable that in recent years, mortality improvements have exhibited a very different pattern amongst younger and older populations. We looked at this in a recent post: Were 2024 mortality rates in England & Wales actually similar to those in 2019? Whilst overall mortality rates in 2024 were slightly lower than in 2019, amongst under 55s they were significantly higher in 2024 than in 2019.
The CMI Mortality Projections Model estimates current rates of mortality improvement in the population and projects these into the future. Capturing the current unusual pattern of mortality improvements by age is proving a challenge under the current structure of the model.
What’s the issue with the current model?
The CMI model works by estimating current rates of mortality improvement (“initial rates”) and then blending these into an assumed long-term rate of improvement.
The model uses 40 years of England & Wales population data to estimate these initial rates. As part of that calculation, it assumes that mortality improvements vary by year (referred to as period effects) and that in any given year, those improvements also vary by age (referred to as age effects)1. Under its current construction, it assumes that these age effects are fixed over the 40-year calibration period.
By way of example, we show the combined age and period effects using the existing methodology, based on data for England & Wales men between 1994 and 20242.
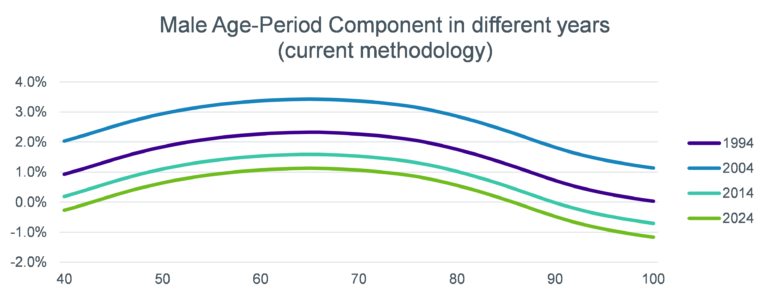
We can see that mortality improvements at all ages were assumed to be highest in 2004 and lowest in 2024. However, because the shape of improvements by age is fixed throughout the calibration period, the recent trend of negative mortality improvements amongst under 55s isn’t picked up by the green line. This green line will be used as the starting point for the projection, so negative improvements at younger ages won’t be included in the projection.
How might CMI_2024 address this issue?
The CMI Mortality Projections Committee have proposed a significant change to the way initial rates are estimated. It is proposed that the model contains “multiple period terms”, so that period effects (i.e. the headline rate of improvements each year) can also vary by age.
Under the proposed core CMI_2024 model, this would lead to a different shape for the initial rates, which seemingly better captures the negative improvements seen at younger ages.
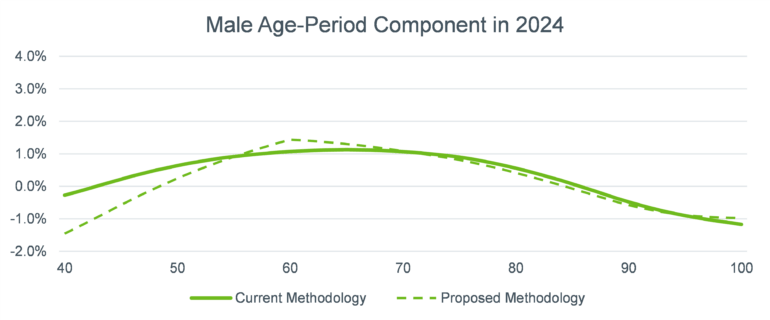
Here we can see that the proposed model now allows for negative mortality improvements at younger ages. On the face of it, this seems a better outcome. It is interesting to note that there is only a very modest impact at ages 65 and above, the age range we most care about when thinking about defined benefit pension scheme members.
What is driving low improvements at younger ages?
By allowing for negative improvements at younger ages, the projection will allow for mortality rates amongst those aged below 50 to continue to increase in the short-term. An important question for users of the model is whether they want this feature in the model. To answer this question, we need to think about what is driving the trend of negative mortality improvements at younger ages.
We would note that there are several different reasons why we might be seeing increasing mortality rates in this population.
Deaths of despair: Some commentators have highlighted the role of rising levels of deaths from drugs, alcohol and suicide on younger age mortality rates, both before and in the aftermath of the pandemic.
If this is an ongoing trend amongst younger people, a model which allows mortality rates to continue to increase in the short term at younger ages seems a reasonable approach.
Lingering impact of the pandemic: COVID lockdowns were very disruptive to younger people, narrowing employment and education opportunities as well as limiting social engagement. Could these challenges have exacerbated the existing trend of increasing rates of deaths of despair?
If this is the case, would the pattern of elevated mortality at younger ages in the post pandemic data be better captured in the Fitted Overlay3 component of the updated model?
Deleterious lifestyle changes: Are the current generation of under 55s less healthy than previous generations were at the same age due to factors such as sedentary lifestyles and poor diets?
If this is the case, shouldn’t this emerging trend also impact that generation’s future life course? i.e. this emerging trend should be modelled as a cohort effect not a period effect.
Misestimation due to migration: The UK has seen very high levels of migration in recent years. The calculation of mortality rates relies on population estimates. High levels of migration make these estimates more uncertain amongst younger adults who are most likely to immigrate or emigrate.
Could we be underestimating the total population at younger ages and hence overestimating mortality rates? Do we have enough confidence in the data at younger ages to make such a significant change to the model?
Added complexity for little added benefit?
Our view at Club Vita is that we are yet to be convinced that the introduction of Multiple Period Terms into the core CMI Model is necessary.
The change is a significant one, and one that comes at the cost of adding further complexity to what is already a very complex model. For many users, mortality improvements at younger ages are not an important consideration. Given the significant additional complexity added, we would like to see a stronger case made that the new approach leads to a significantly better model across all ages.
We also wonder whether users who are interested in younger age mortality might in any case want to make their own adaptations to the model to reflect their own views on what is driving recent trends at younger ages. Finally, we also have some concerns about the accuracy and stability of the mortality rates at younger ages that are relied upon in the new model.
In our response to the consultation on the proposed CMI_2024 model, we proposed that the Multiple Period Terms functionality is kept for the time being as an advanced parameter for the benefit of advanced users of the model.
What happens next?
The Projections Committee have carried out a consultation on the proposed model, which has now closed. You can read Club Vita’s response to the consultation at here.
We are expecting the committee to provide an update on next steps following the consultation during mid-April. The final version of CMI_2024 is expected in the second quarter of 2025.
What do you think?
We’d love to hear your thoughts on Multiple Period Terms or any other comments or questions you have on the proposed CMI_2024 model
1A third component, that mortality improvements vary by birth year (referred to as cohort effects) also applies. In this blog, we deliberately focus on age and period effects.
2Output from and advanced run of the WP197 Illustrative Software with “old style” cohort constraints and 1 period term.
3Changes afoot in the CMI Model. Part One: Introduction of a Fitted Overlay
Changes afoot in the CMI Model
Part Two: Multiple Period Terms