


The Canadian Institute of Actuaries (CIA) recently published the 2024 Canadian Pensioner Mortality Research Project. This represents a long-awaited refresh of the CIA’s baseline pensioner mortality tables for the Canadian pension industry. The new baseline mortality tables published alongside the report are called the Canadian Pensioner Mortality 2024 (CPM2024) tables.
In our previous three blogs in this series we provided an overview of the construction of these tables, discussed how well the new tables capture the diversity of experience seen across Canadian pension plans and explored the approach taken to allow for the COVID-19 pandemic. In this article, we explore the considerations practitioners should take into account when setting future mortality improvement assumptions for use with the new CPM2024 tables.
The next (and final) blog in this series will focus on considerations for using the CPM2024 in experience studies.

Baseline and Trends / Improvements
There are two essential building blocks for estimating future mortality:
- the current rates at which people of different ages are expected to die over the following year (known as current or baseline mortality); and
- how these rates are expected to change in the future (known as future mortality trends or improvements).
Combining these two components provides mortality rates in any future year and allows you to estimate how long people who are alive today will live.
When selecting baseline and future improvement mortality assumptions for a given purpose, it is important to pick assumptions appropriate for that purpose and assumptions that interact in a consistent manner. The key features of CMP2024 for assessing compatible improvement assumptions are:
- They are calibrated to Canadian defined benefit (DB) pensioner data
- The effective date of the tables is 1 January 2024
- They have had the impact of spring 2020 COVID-19 peak removed
General population vs DB pensioners
The CPM2024 tables are calibrated to Canadian DB pensioner data and are designed to provide mortality rates representative of average Canadian DB pension plans. We therefore expect the most common use of these tables will be to value liabilities for Canadian DB pension plans, and they should be paired with improvement assumptions that are appropriate for that purpose.
Both the CPM2024 calibration dataset and Club Vita data indicate that in the recent past, the Canadian DB pensioner population has experienced higher mortality improvements than the general population:
- In the CPM2024 study, the researchers develop their own improvement scale from 2011 to 2024 based on the CPM data (with the impact of COVID-19 removed), known as CPM2024 H1D available here. They observe that this improvement scale gives higher improvements, particularly for men, over this period than the recent CIA-MI-2024 improvement scale, which was calibrated to general population data.
- Recent Club Vita research has also found that recent mortality improvements have been higher in Canadian DB pensioners compared to the general population, and even higher in DB pensioners from higher socio-economic groups.
Practitioners will need to consider these findings when assessing an improvement scale to use in projecting future mortality rates for Canadian DB pensioners. Will this difference in improvements persist in the short term, in the long term, and/or only for some socio-economic groups? And does any proposed improvement scale reflect these views?
COVID-19 considerations
The elevated mortality during the COVID-19 pandemic has created some specific challenges for setting mortality assumptions, and in particular for how to combine baseline mortality and improvement scales.
Base tables are usually constructed using several years of data. However, when we combine base tables with improvements, we typically apply improvements from the effective date of the base tables, which is often but not always the central year of the base table dataset.
It is important to consider both the effective date of the baseline mortality assumptions and whether the data used to construct the tables has been affected by elevated mortality during the COVID-19 pandemic. To the extent that the calibration data for a set of base tables straddles the pandemic period, it is critical that they are paired with a set of mortality improvements that take a consistent approach to COVID.
The CPM2024 base tables are calibrated to data from 2011 to 2021, however the impact of elevated mortality due to COVID in the spring of 2020 has been removed (see our previous blog on allowing for COVID-19 for more details). In addition, the effective date of the mortality rates has been rolled forward to January 1, 2024, using a trend assumption derived from the pre-COVID experience seen in the data set.
The charts below illustrate the landscape of COVID-19 mortality data using Canadian population level data. They show standardized mortality rates (SMRs) for the Canadian general population averaged over a fixed population aged 65 to 95. The purple dots show the actual mortality rates from the Canadian population data. The grey dotted line shows the estimated underlying trend in mortality rates based on (pre-COVID) data up to 20191.
The green dot shows an estimate of mortality during 2024 based on pre-COVID data rolled forward using the pre-COVID trend. As you can see, this estimate gives somewhat lower mortality than the observed (provisional) Canadian population mortality during 2024. The mortality rates in the CPM2024 base tables are equivalent to this green dot but calculated using the CPM DB pensioner population rather than the general Canadian population.
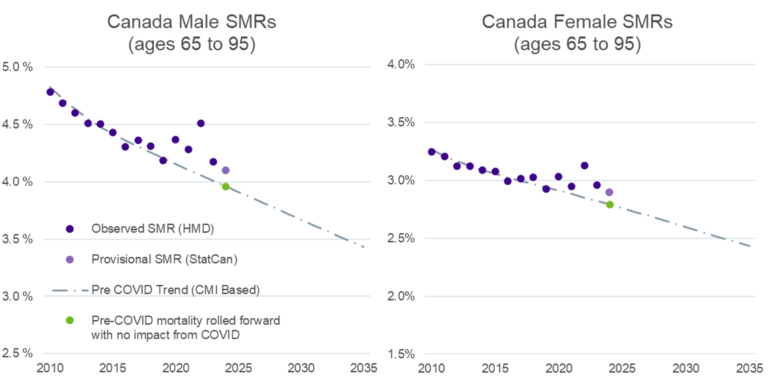
Source: Data up to 2023 from the Human Mortality Database (www.mortality.org), 2024 data estimated using StatisticsCanada life table. Pre-COVID trend based on the CMI_2024 model calibrated to data up to 2019 with a 1.3% long term rate.
The fact that CPM2024 mortality rates have had the impact of COVID-19 stripped out provides us with a useful, unambiguous starting point for our modelling. How we project them forwards from their 2024 effective date will depend on our view of what the long-lasting effect of the COVID pandemic will be on mortality rates.
View 1: the COVID-19 pandemic has not had a long-lasting effect on mortality rates
If your judgement is that COVID-19 will have no long-lasting impact on mortality rates, then you need to pair base tables like CPM2024 with a mortality improvement assumption that includes no effect of COVID-19 from 2024 into the future.
One option for this is to use an improvement assumption based on pre-pandemic trends. There a number of choices for this option, including the three commonly used models published by the CIA: CPM-B (calibrated to data up to 2011), MI-2017 (calibrated to data up to 2013) and CIA-MI-2024 (calibrated to data up to 2019), or using an alternative model calibrated to Canadian data, such as the CMI model illustrated previously. The charts below show these alternatives. We note this option, pairing CPM2024 with CIA-MI-2024, has been proposed by the CIA for use in commuted value calculations in their recent consultation.
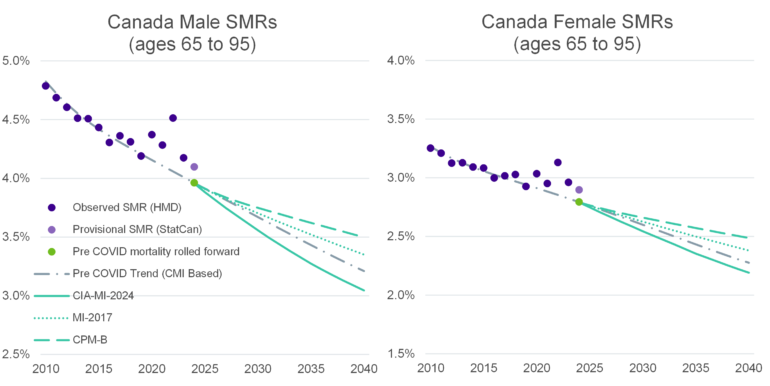
Source: Data up to 2023 from the Human Mortality Database (www.mortality.org), 2024 data estimated using StatisticsCanada life table. CIA-MI-2024, MI-2017 and CPM-B all available from the Canadian Institute of Actuaries (www.cia-ica.ca). CMI based pre-COVID trend based on the CMI_2024 model calibrated to data up to 2019 with a 1.3% long term rate.
There also are various methodologies for calibrating future improvement assumptions that make use of data during the pandemic and post-pandemic periods. The UK’s Continuous Mortality Investigation has developed a modelling feature called a “fitted overlay” to build in actuarial judgement around how much recent high mortality is due to the lingering effects of the pandemic into improvement scales. We have explored this modeling technique in detail in a recent Club Vita webinar.
The chart below shows one calibration of a fitted overlay applied to Canadian population data, assuming that recent higher levels of mortality are temporary and that mortality will soon return to pre-pandemic expectations. We have also shown the underlying trend of mortality rates with the assumed impact of the pandemic stripped out.
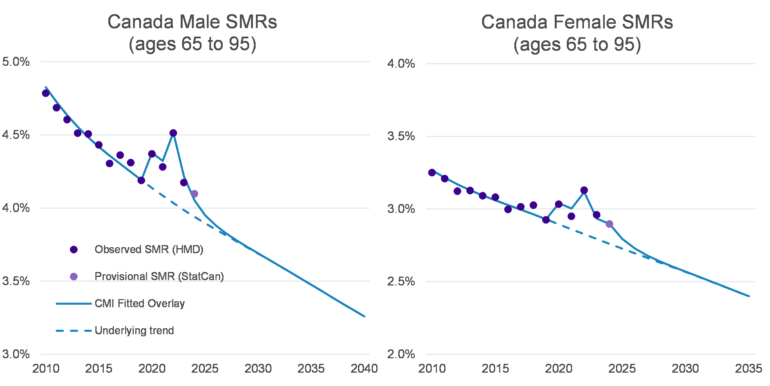
Source: Data up to 2023 from the Human Mortality Database (www.mortality.org), 2024 data estimated using StatisticsCanada life table. Fitted Overlay and underlying trend from Club Vita advanced calibration of CMI_2024 model to Canadian population data with a 1.3% long term rate.
Warning: The fitted overlay approach itself is incompatible with tables such as CPM2024. This approach assumes some high short-term improvements to get recent elevated mortality rates to return to pre-pandemic expectations – and these are incompatible with a base table that has already had the impact of COVID-19 stripped out. To use the fitted overlay modelling technique with tables such as CPM2024 that have had COVID experience removed, we would need to use the underlying trend from the model instead – as shown in the blue dotted line in the chart above.
View 2: the COVID-19 pandemic has had a long-lasting effect on mortality rates
Of course, it is possible that the pandemic may have left a long-lasting impact on mortality rates in Canadian pension plans. If you judge this to be the case, care will be needed in setting mortality rates in the post-pandemic environment, and it will not be appropriate to use base tables with the COVID impact removed alongside pre-pandemic improvements.
There are a number of options for this case including step-change adjustments to baseline mortality rates, adjusting long term improvement rates and calibrating initial improvements to emerging data assuming we are entering some kind of “new normal” post-pandemic period. Below we show the resulting trajectory of mortality rates if you calibrated an improvement model to Canadian population data up to 2019 and 2023-2024, essentially skipping the impact of 2020-2022 data and assuming 2023-2024 is the new-normal period. Relative to this view, the CIA-MI‑2024 which is solely based on pre-pandemic data scale would generally imply higher mortality improvement rates in the short to medium term, reflecting a more optimistic outlook.
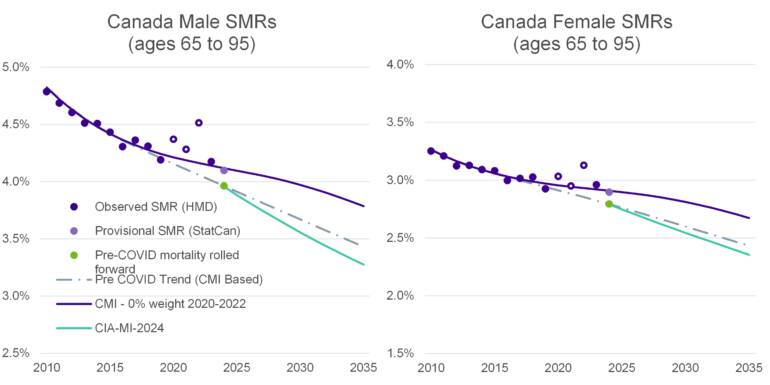
Source: Data up to 2023 from the Human Mortality Database (www.mortality.org), 2024 data estimated using StatisticsCanada life table. Pre-COVID trend based on the CMI_2024 model calibrated to data up to 2019 with a 1.3% long term rate. “CMI – 0% weight 2020-2022” is based on the CMI_2024 model, with no fitted overlay and applying W parameters of 0 to the years 2020-2022. Note the three “empty” dots for data in 2020, 2021 and 2022 have not been used for the calibration of the improvement assumption.
Warning: The improvement rates calibrated using this new-normal approach begin from higher levels of mortality in 2024. If you were to pair this approach with tables such as CPM2024 (approximated by the green dots in the charts above) you may need to increase the baseline mortality rates in the tables to reflect this higher starting point.
What do you think?
There are many actuarial judgements made when calibrating future mortality improvement scales; different methodologies and different calibration periods can result in different levels of projected mortality improvements. Judgement is always needed to assess which improvement assumption is appropriate for a given purpose. Some key questions to consider:
- Do you think the improvements captured in the recent CIA-MI-2024 tables are representative of future improvements of Canadian DB pensioners?
- Do the levels of COVID-related excess mortality in your base table and improvement projection line up??
- Do you think the pandemic will have any long-lasting impact on morality rates? And are these views reflected in your assumptions?
- Are pre-pandemic assumptions a reasonable way to project mortality rates forward for pensioners who survived the pandemic?
We’d love to hear your views, please contact us with any comments or questions.
1 Here we have used the CMI_2024 edition of the Continuous Mortality Investigation’s Mortality Projections Model. This model is produced on behalf of the UK actuarial profession. It has the flexibility to be calibrated to Canadian population data and suitably parameterised to reflect nuances of the Canadian population.